Goldman Sachs Research
European Economics Analyst
Euro Area—Debt Sustainability and Higher Rates (Stott)
28 November 2023 | 10:58PM GMT | Research | Economics| By Sven Jari Stehn and others
More
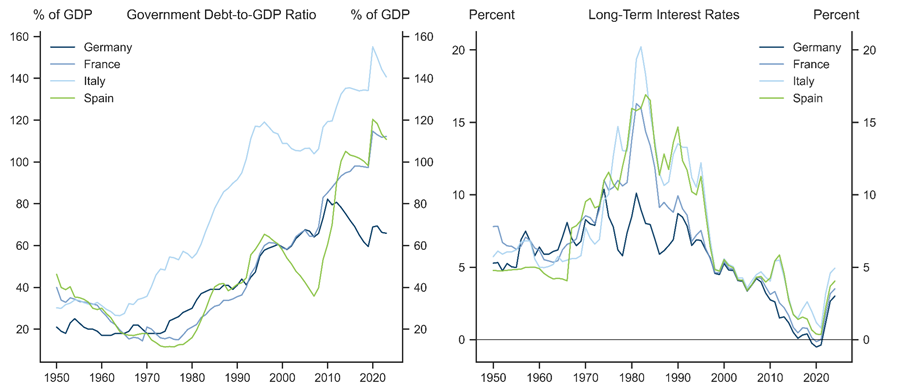
  • The increase in long-term interest rates has brought the longer-term outlook for debt sustainability back into focus. The limited changes in long-term real growth and inflation expectations imply that the differential between the effective interest rate on debt and nominal growth (i-g) is set to return close to its late-1990s average. The ratio of primary (ex interest) balances would therefore have to improve by 1pp to 3pp of GDP to prevent an increase in the debt ratio—the simplest criterion for debt sustainability.

  • Our assessment suggests that the required consolidation paths look largely attainable. First, primary balances will need to reach terminal levels which remain well within the historical range for most countries, albeit at the upper end for Italy. Second, the pace at which primary balances will have to improve falls short of our estimates of so-called “speed limits” to consolidation. Lastly, we see reasons to look for consolidation efforts to be relatively less detrimental to growth than in the past.

  • Our central case is, however, exposed to risks, and the past few years have shown that the sources of shocks hitting the economy can be very relevant to debt dynamics. The energy crisis, for instance, has been a significant drag on growth and triggered a forceful policy response, but is likely to leave the debt ratio broadly unchanged because of the diluting effects from inflation. Our analysis suggests that debt trajectories in the Euro area are most exposed to an unwarranted tightening in interest rates, where interest rates rise despite weaker growth and inflation.

  • While central banks have historically helped achieve debt sustainability by, for instance, maintaining deeply negative real rates in the post-war era, the return of inflation in the Euro area has exposed two different trade-offs. A forceful response of policy rates to inflation anchors inflation expectations and helps contain the inflation premia embedded in government bonds, all else equal. And while the use of the central bank’s balance sheet is never a “free lunch,” the perceived credibility of the ECB’s commitment to guard against non-fundamental sovereign stress has so far proven to be relatively cheap and effective.

Euro Area—Debt Sustainability and Higher Rates

Public debt ratios in the Euro area stand at elevated levels by post-war standards (Exhibit 1, left). The increase in long-term interest rates—and the upward revision to longer-term forwards, in particular—has refocused attention on the longer-term outlook for debt sustainability (Exhibit 1, right).

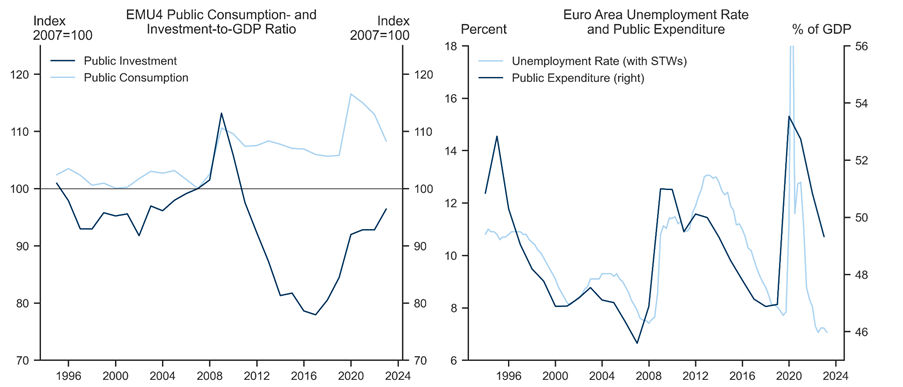
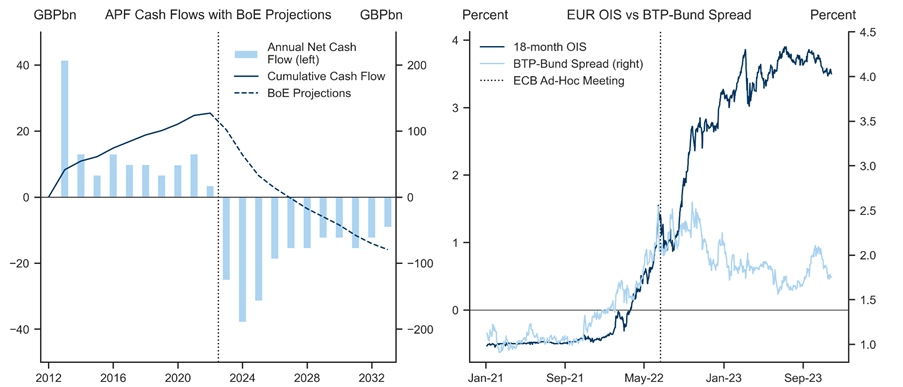
Exhibit 1: Setting the Scene

1. Setting the Scene. Data available on request.
We splice back OECD data with the Jorda et al. (2017) macro-history database.
Source: Goldman Sachs Global Investment Research, Haver Analytics, Jordà et al. (2017)
In this week’s Analyst, we therefore assess the challenges posed by higher rates to debt sustainability.

Sizing The Challenge

We start with the simple definition for debt sustainability that the debt-to-GDP ratio is on a non-increasing trajectory. The textbook approach takes the macroeconomic backdrop—of real growth, inflation and interest rates—as given and uses the debt accumulation equation to back out the lowest primary balance necessary to keep debt from increasing. This gives a benchmark consolidation path which we can compare against hurdles, such as the long-term level for the primary balance, the pace at which it must improve, or the composition of the consolidation effort.
We first review the evolution of the long-term macroeconomic outlook. It is, in that respect, remarkable how little long-term real growth and inflation expectations have changed over the last few years (Exhibit 2, left). Regarding real growth, we have long argued that the Covid and energy crises would be more likely to leave scars to the long-term level of output than on its growth rate. Long-term inflation expectations have so far stayed well anchored and have risen only modestly, back to 2%. Market pricing, on the other hand, implies that the increase in long-term interest rates could be sustained in the future. Once debt is rolled over at this higher cost, we estimate that the differential between the effective interest rate on debt and nominal growth (i-g) will have returned to its 1990 – 2008 average (Exhibit 2, right). That is, close to zero for Germany, France and Spain, and modestly positive for Italy.

Exhibit 2: Interest Rate – Growth Differential Deterioration

2. Interest Rate – Growth Differential Deterioration. Data available on request.
On the left, we show Consensus Economics expectations for Euro area real GDP growth and headline inflation 6 to 10 years ahead. On the right, we splice back OECD data with the Jorda et al. (2017) macro-history database. The dashed lines use IMF forecasts for nominal growth. We compute the effective interest rate by conditioning on market pricing for the tenor of the average maturity and assume that debt is rolled over at a rate of 1/(average maturity) per year.
Source: Goldman Sachs Global Investment Research, Consensus Economics, IMF, Jordà et al. (2017), Haver Analytics
We can then back-out the lowest level of primary balances which keeps the debt ratio from increasing, given by (i-g)/(1+g) * debt ratio. We first note that primary balance ratios will have to improve by 1pp to 3pp of GDP to offset the deterioration in the interest rate – growth differential (Exhibit 3, left). That said, Germany, France, and Spain should continue to be able to run primary deficits close to their historical median. While the primary surpluses required in Italy are not unusual by historical standards, they would need to approach the country’s 20th post-war percentile (Exhibit 3, right). We therefore cautiously conclude that the level of primary balance required by the higher interest rates looks attainable.

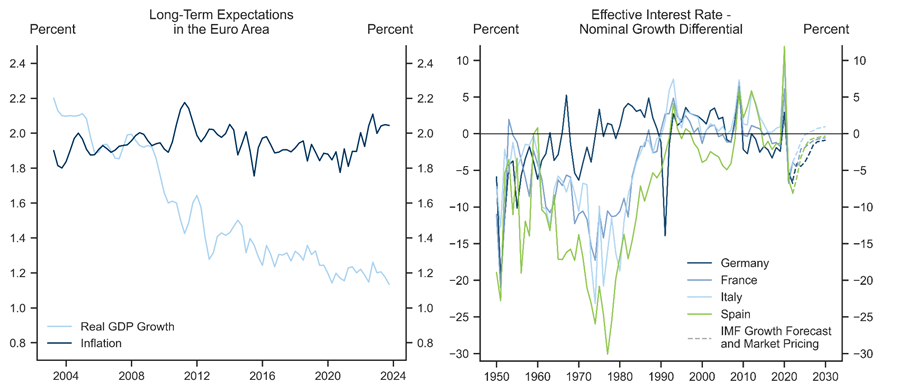
Exhibit 3: Primary Balances Back Within their Historical Range

3. Primary Balances Back Within their Historical Range. Data available on request.
On the left, debt-stabilising primary balances are computed using IMF forecasts for nominal growth and market pricing for rates. On the right, we show the kernel-smoothed historical distribution of primary balances obtained from splicing OECD data back with the Jorda et al. (2017) macro-history database.
Source: Goldman Sachs Global Investment Research, Haver Analytics, Jordà et al. (2017), IMF
The pace at which governments will need to run their fiscal consolidation reflects the speed at which the effective cost of debt will incorporate higher spot interest rates, for a given nominal growth outlook. The lengthening of government debt maturities during the past decade—by 1.7 years on average across the Euro area—will provide governments with a helpful buffer. We have long argued that maintaining a sustainable pace is key to achieving a successful consolidation, as governments often face so-called “speed limits.” Intuitively, faster adjustments typically become counterproductive and lead to a smaller improvement in primary balances, as growth deteriorates and governments are obliged to cut taxes. We find evidence of such speed limits in France, Italy, and Spain, but not in Germany (Exhibit 4, left).[1] While governments currently plan to run primary balances above their debt-stabilising thresholds in 2024, our calculations suggest that speed limits could bind in Italy and Spain in 2025 if governments do not maintain a robust pace of consolidation into next year (Exhibit 4, right).

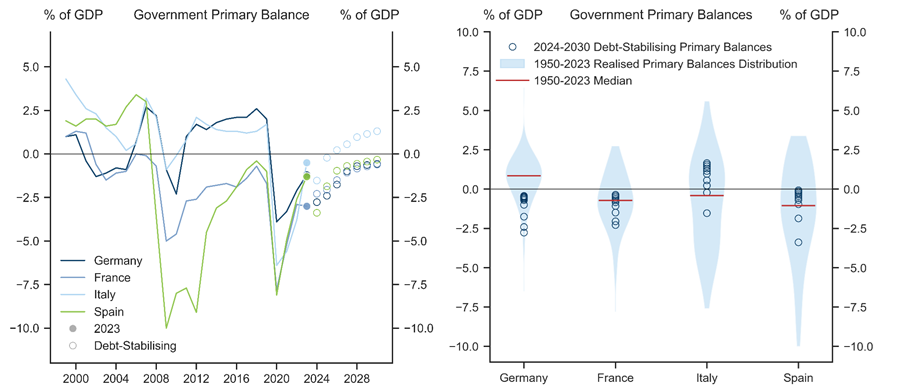
Exhibit 4: Consolidation Pace Unlikely to Bind

4. Consolidation Pace Unlikely to Bind. Data available on request.
On the left, a leftward move implies a greater consolidation effort. On the right, red dashes indicate the x-coordinate of the parabolas' maximum on the left, given by (-b/2*a) for the specification y = a*x^2 + b*x + c, with y the change in the primary balance and x the change in government expenditure.
Source: Goldman Sachs Global Investment Research
Turning to the composition of adjustment efforts, we have shown that expenditure-based (as opposed to revenue-based) consolidations tend to weigh less on growth and have a higher chance of succeeding in improving the fiscal position sustainably. It is therefore encouraging from this perspective that governments have so far shown little appetite to raise taxes in their near-term fiscal strategies. However, a lesson from the Euro area debt crisis is that reducing expenditure by cutting public investment rather than scaling back government spending (consumption and transfers) could weigh on an economy’s growth potential and eventually prove self-defeating in decreasing the debt ratio (Exhibit 5, left).
We see two reasons to be more constructive on the spending/investment mix during the upcoming effort to contain public expenditure. First, the European fiscal framework now explicitly calls for countries to protect public investment and will be helping to fund investment via the Recovery Fund until at least 2026. Second, the labour market reforms undertaken by countries over the last decade have likely lowered natural unemployment rates and created sizeable fiscal room (Exhibit 5, right). A simple visual examination would suggest that government consumption and transfers across the EMU4 are 3pp of GDP higher than historically implied by the unemployment rate. Shrinking this gap would make a large step towards the 1-3pp range we outlined above while protecting investment.

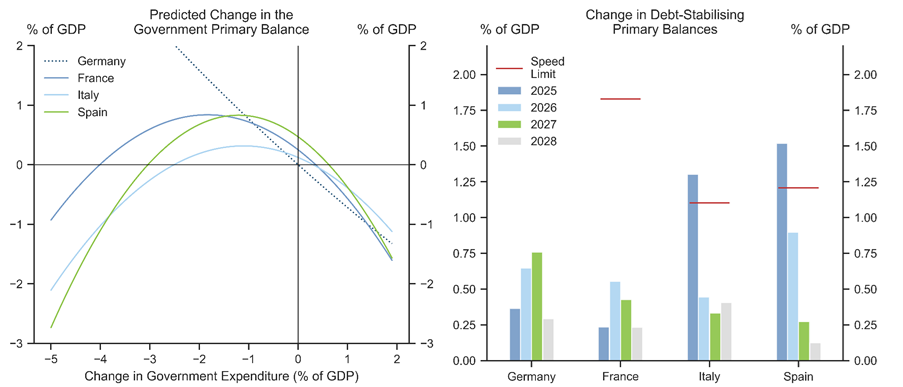
Exhibit 5: Scope for More Growth-Friendly Consolidation Efforts

5. Scope for More Growth-Friendly Consolidation Efforts. Data available on request.
On the right, we augment the EA20 unemployment rate with a weighted-average of Short-Term Work schemes (STWs) take-up in Germany, France, and Italy.
Source: Goldman Sachs Global Investment Research, Haver Analytics
Overall, the challenge that higher interest rates pose to preventing the debt ratio from increasing looks manageable, albeit more challenging in Italy. The two key assumptions underpinning this assessment are that (i) the composition and pace of fiscal consolidations do not lead to a significant deterioration in nominal growth and (ii) debt is rolled over at higher costs in an orderly manner.

Sources of Risk

Our central case is, however, exposed to risks, and the past few years have shown that the sources of shocks hitting the economy can be very relevant to debt dynamics. The energy crisis, for instance, has been a significant drag on growth and triggered forceful fiscal and monetary responses. But these upward pressures on debt dynamics were offset by the surge in inflation and left debt ratios broadly unchanged. The Euro area sovereign crisis, in contrast, presented a much more challenging macro environment of lower growth, lower inflation and higher interest rates, which left debt ratios higher on net despite sharp fiscal consolidation.
We can study the relevance of different sources of risk to the fiscal outlook with a so-called “vector auto-regression.” We can use the cross-correlation of statistical residuals to the growth, inflation, and interest rates processes to infer uncorrelated shocks (Exhibit 6). We classify as demand-induced those shocks that push output above potential, boost inflation, and lead long-term rates to increase. Supply shocks push activity and inflation in the opposite direction and are agnostic with respect to the response of long-term rates. Policy shocks see output and inflation fall against rising long-term rates.
We then trace out the historical response of primary balances to each of these shocks across eight Euro area economies with so-called “local projections.” We show our estimates at the bottom-right of Exhibit 6. The primary balance tends to deteriorate following a demand shock but improves after a supply shock. Policy shocks are the most challenging from a fiscal perspective and eventually lead the primary balance to consolidate.

Exhibit 6: Fiscal Environment and Macro Shocks

6. Fiscal Environment and Macro Shocks. Data available on request.
All shocks are rescaled to generate a 1pp increase in the output gap at peak. The top- and bottom-left charts show the average impulse response from a sign-restricted VAR across the EMU4. The impulse response of the primary balance shown in the bottom right is obtained from local projections run on a wider panel of EA8 countries with time and country fixed effects. The sample for both is 1990Q1:2019Q4.
Source: Goldman Sachs Global Investment Research
We compute the effects of the three types of shock on the area-wide average debt ratio via the debt accumulation equation (Exhibit 7, left). The debt ratio tends to increase sharply following a negative demand shock, as observed during the early years of the GFC and the Covid pandemic. Monetary policy responds rapidly with lower rates but the benefits to borrowing costs only accrue slowly as debt is gradually rolled over, and eventually falls short of offsetting the fall in nominal output (Exhibit 7, right). Supply shocks tend to improve debt dynamics because monetary and fiscal policy responses have historically been muted. Policy shocks are, as expected, the most detrimental to the debt ratio.

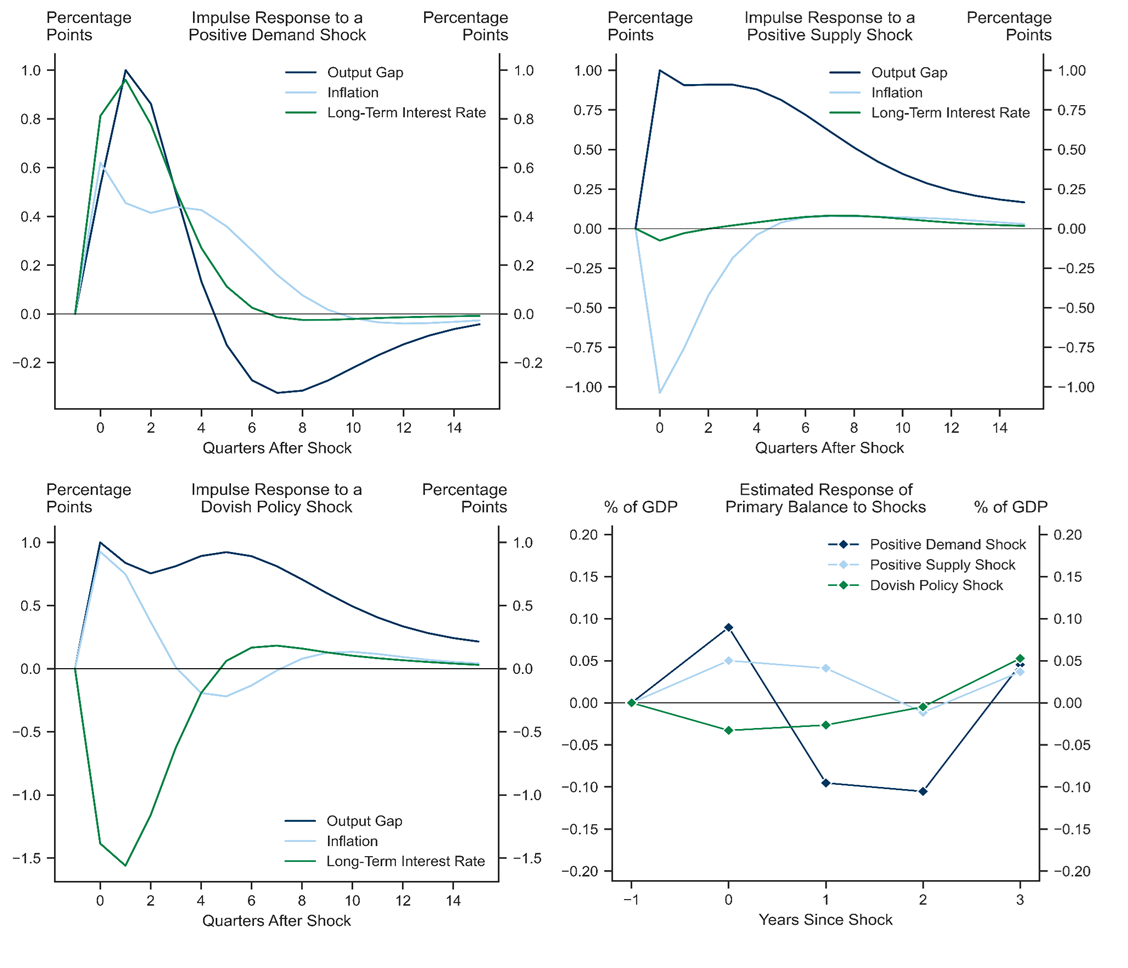
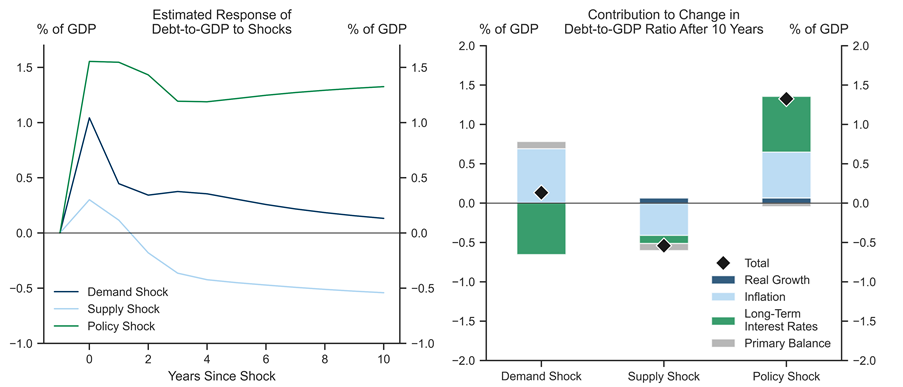
Exhibit 7: Policy Shocks Most Challenging From a Fiscal Perspective

7. Policy Shocks Most Challenging From a Fiscal Perspective. Data available on request.
On the right, we decompose the contribution of each variable to the change in the debt ratio following the method of Hall and Sargent (2020).
Source: Goldman Sachs Global Investment Research
We see two key takeaways from our analysis. First, our baseline for debt ratios to fall slightly in coming years is consistent with the response historically observed in the years following demand and supply shocks, such as the Covid pandemic and the energy crisis. Second, debt trajectories in Europe are most exposed to an unwarranted tightening in interest rates, where interest rates rise despite weaker growth and inflation.

The Central Bank’s Role

Our assessment so far points to two episodes during which central banks played a key role in affecting debt sustainability in Europe. Real policy rates remained deeply negative following WW2 and helped disinflate public debt ratios. More recently, the ECB made use of its balance sheet to narrow sovereign spreads to circumvent the lower bound for rates. But these two episodes also revealed the trade-offs a central bank faces with respect to debt sustainability.
Loose monetary policy during the post-war era came at the cost of de-anchored inflation expectations (Exhibit 8, left). The loss of investor confidence in the nominal value of public debt eventually required a forceful monetary response which forced the government onto a consolidation track. In other words, the central bank had to become systematically more reactive to inflation surprises. Shown formally, the coefficient on inflation in a Taylor Rule for Euro area policy rates increased after the 1970s and has settled at a higher level since the Euro area’s inception (Exhibit 8, right). More recently, the indirect benefit of the ECB hiking rapidly in the face of surging inflation has been the continued anchoring of long-term inflation expectations, which would, all else equal, have helped contain the increase in long-term rates.

Exhibit 8: Policy Rates and Debt Sustainability

8. Policy Rates and Debt Sustainability. Data available on request.
On the left, the full dark blue line shows Consensus Economics expectation for inflation 6 to 10 years ahead. The dashed dark blue line shows the long-term forecast for inflation obtained from a time-varying parameters VAR of the Euro area policy rate, headline consumer price inflation, and real GDP growth. On the right, the dashed dark blue line shows the time-varying coefficient of the response of the policy rate to inflation from the same VAR. A more positive coefficient indicates a more systematic response of monetary policy to inflation.
Source: Goldman Sachs Global Investment Research, Consensus Economics, Haver Analytics
The increasing use of the central bank’s balance sheet also has fiscal implications. The purchase of government bonds has exposed central banks to negative income streams and portfolio losses. In the UK, for instance, HMT must now recapitalise the BoE’s Asset Purchase Facility and, and the BoE expects the program to have made a cumulative net loss when fully wound down (Exhibit 9, left). This issue is much less acute for the Eurosystem given the lower maturity of the bonds purchased, the buffer from higher coupon payments, and the less direct linkages between monetary and fiscal authorities. Rather, the main implication of ECB’s balance sheet for debt sustainability this cycle has come from the announcement of the Transmission Protection Instrument (Exhibit 9, right). Committing to protect sovereigns from self-fulfilling (non-fundamental) debt spirals has so far proven to be a relatively “cheap lunch,” as the central bank has not yet had to back its commitment to preserving policy transmission through actual purchases.

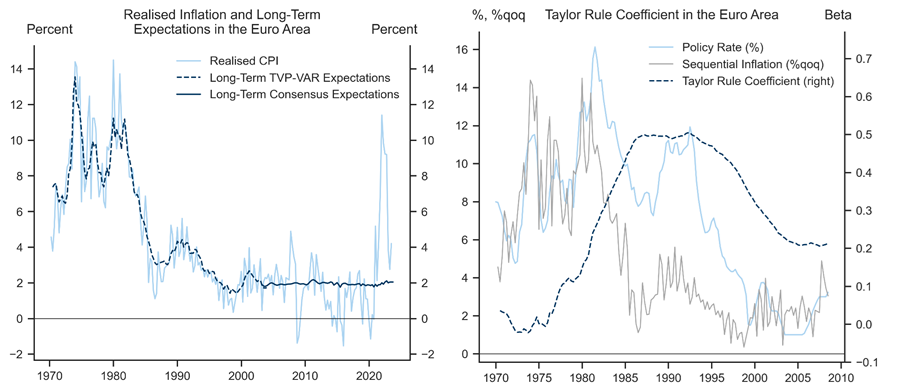
Exhibit 9: Balance Sheet Policy a "Cheap Lunch" Thus Far

9. Balance Sheet Policy a "Cheap Lunch" Thus Far. Data available on request.
The left shows a visual approximation of scenario 1B in the BoE's 2023Q3 APF report. For details, see https://www.bankofengland.co.uk/asset-purchase-facility/2023/2023-q3
Source: Goldman Sachs Global Investment Research, Bank of England, Haver Analytics
Looking forward, debt sustainability in the Euro area will primarily hinge on the ability of governments to offset the deterioration in the macroeconomic environment with higher primary balances. Monetary policy can also support this effort by striking a balance between controlling inflation and avoiding a costly policy error, and by maintaining its commitment to rule out non-fundamental debt spirals.
Alexandre Stott
  1. 1 ^ We regress the change in primary balances on the change in expenditure and the squared change in expenditure. The coefficient on the squared change in expenditure is negative and statistically significant for France, Italy, and Spain. This coefficient in Germany is not statistically different from zero.

Investors should consider this report as only a single factor in making their investment decision. For Reg AC certification and other important disclosures, see the Disclosure Appendix, or go to www.gs.com/research/hedge.html.