Real GDP grew by 3.3% year-over-year in 2023Q4, well above expectations and our estimate of potential growth. However, real gross domestic income (GDI), an alternative measure of economic activity derived from income rather than expenditure data, declined by 0.1% year-over-year in 2023Q3, and the gap between the levels of GDP and GDI is now at its highest level since the early 1990s.
Both GDP and GDI are valuable indicators of economic activity in general. Historically, we find that a simple average of the initial estimates of GDP and GDI growth does best at predicting the revised estimates of both indicators. In addition, GDI growth has sometimes been weaker just before the economy goes into recession, leading some commentators to place more weight on it as a signal of inflection points in economic growth.
At present, however, we see some tangible reasons why GDI probably understates growth. First, business net interest payments have subtracted over 1pp from year-over-year GDI growth through 2023Q3. But net interest payments tend to be revised up when rates rise, and we expect revisions this cycle to boost year-over-year GDI growth by around 0.8pp in 2023Q3.
Second, the BEA’s effort to adjust depreciation for the impact of tax policy changes is likely causing corporate profits to be understated in GDI. We find that previous swings in the depreciation adjustment have been associated with large revisions to corporate profits growth, and we estimate that these revisions could boost year-over-year GDI growth by 0.4pp in 2023Q3.
Third, tighter financial conditions since the Fed started hiking have lowered capital gains in 2022-2023 relative to 2020-2021, which is likely lowering GDI growth relative to GDP growth. While GDI is supposed to exclude capital gains, in practice the difference between GDP and GDI is larger when capital gains are lower, and we suspect that lower capital gains are artificially lowering GDI in 2023.
Fourth, the list of state and local government enterprises that are included in GDI has not been updated for several decades, and several of the largest state and local government enterprises no longer meet the criteria for inclusion in GDI. As a result, we estimate that the negative contribution from this component is artificially lowering year-over-year GDI growth by 0.1pp in 2023Q3.
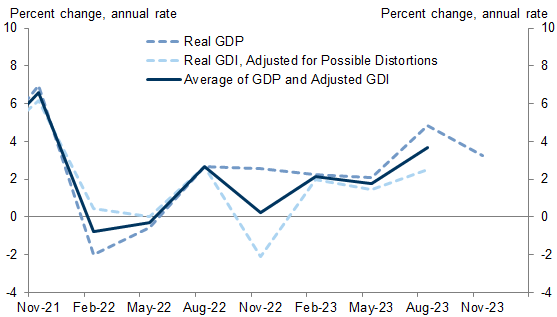
To gauge “true” growth in the four quarters to 2023Q3, we would use the average of GDP (2.9%) and GDI adjusted for our four distortions (1.3%). The resulting 2.1% estimate implies that the US economy grew at a pace close to or very slightly above potential. This is also consistent with the performance of the labor market over the past 12-18 months.
Making Sense of the GDP-GDI Gap
Exhibit 1: The Gap Between GDP And GDI Is the Largest Since the Early 1990s
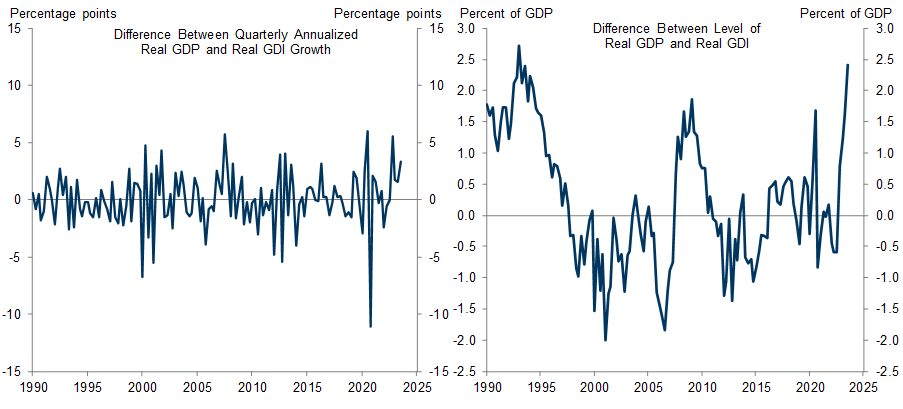
Exhibit 2: The Weakness in GDI Has Been Concentrated in Net Interest Payments and Corporate Profits, Its Most Poorly Measured Components
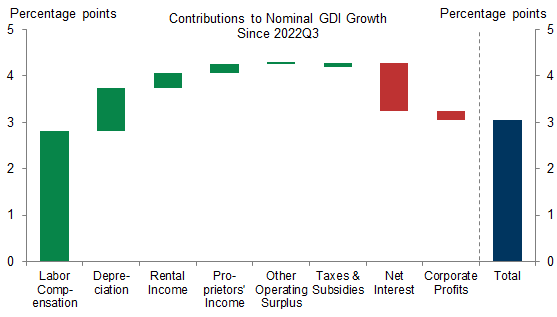
Exhibit 3: A Simple Average of GDP and GDI Predicts the Revised Estimates of Both Indicators the Best
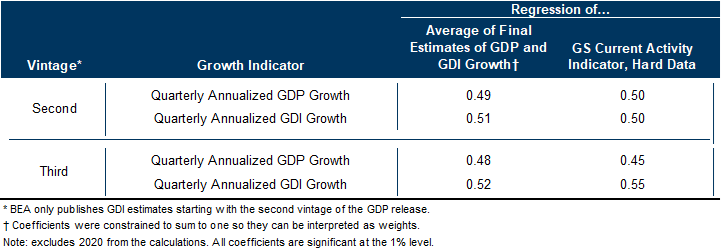
Exhibit 4: Net Interest Payments Have Declined Sharply in Recent Quarters Even as Interest Rates Rose
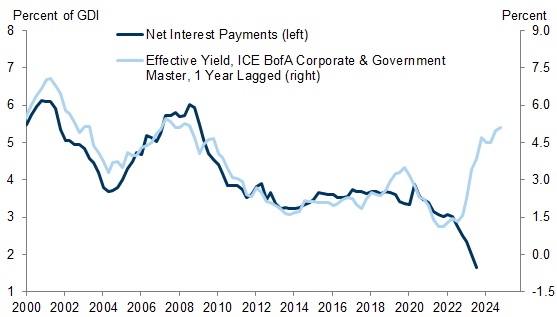
Exhibit 5: Net Interest Payments Tend to Be Revised Up When Interest Rates Rise
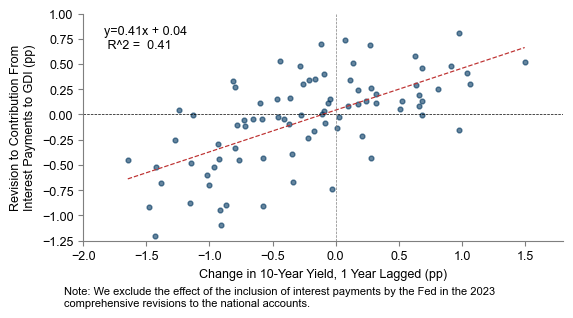
Exhibit 6: Taking the Net Interest Payments Component of GDI at Face Value Would Imply that Corporate Profits From Production Declined by More in 2023 Than at Any Point Since 1970 Except for 2008
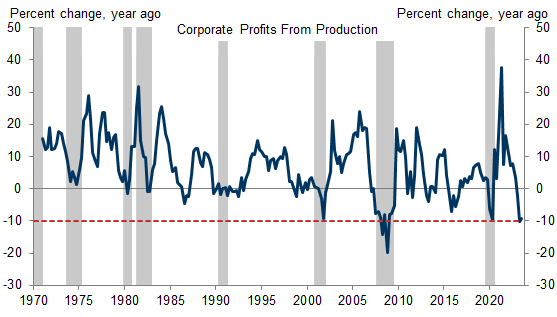
Exhibit 7: The BEA’s Adjustment to Depreciation to Account for the Impact of Tax Policy Changes Is Likely Artificially Weighing on Corporate Profits
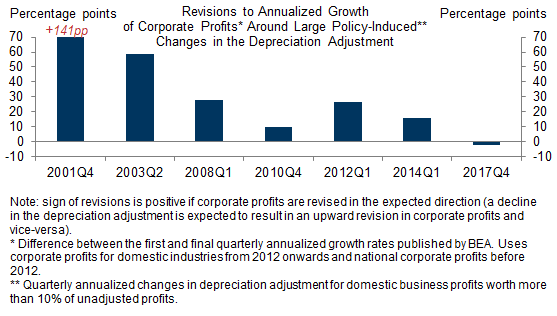
Exhibit 8: Capital Gains Are Likely Lowering GDI vs. GDP in 2023
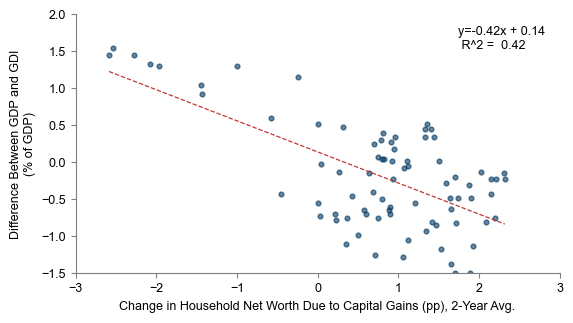
Exhibit 9: The Outdated Classification of State and Local Government Enterprises Is Generating a 0.1pp Drag on YoY GDI Growth in 2023Q3
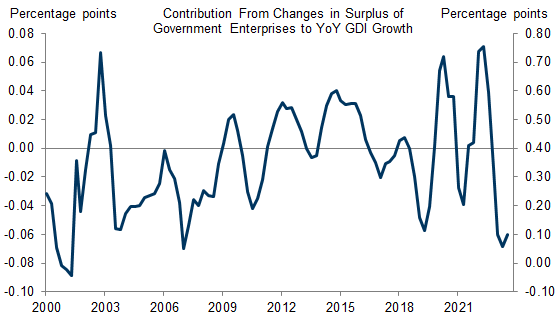
Exhibit 10: Taken Together, GDP and GDI Suggest That Activity Growth Was Modestly Above Potential Over the Last Year
Manuel Abecasis
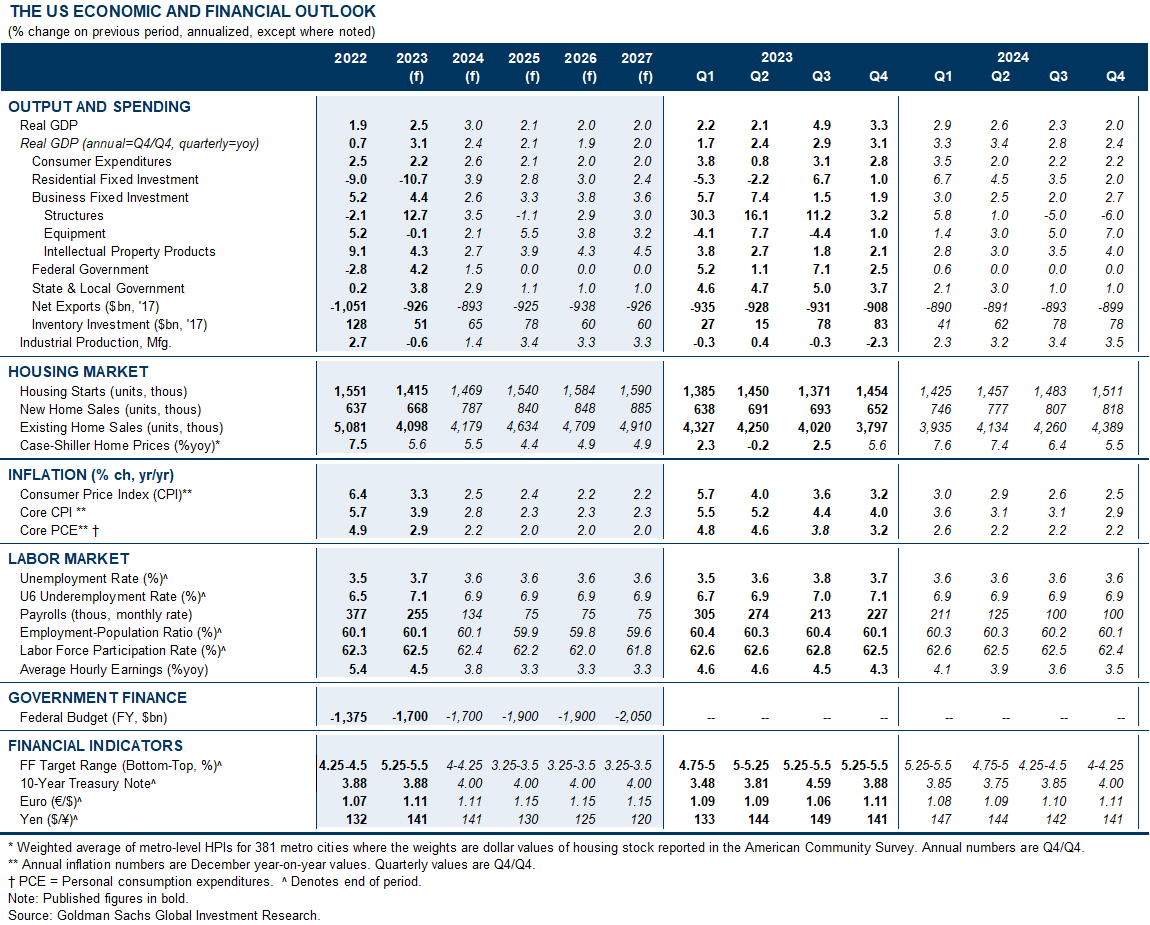
The US Economic and Financial Outlook
- 1 ^ See Dennis J. Fixler, Eva de Francisco, and Danit Kanal, “The Revisions to Gross Domestic Product, Gross Domestic Income, and Their Major Components,” Survey of Current Business 101(1).
- 2 ^ The BEA has recently added a new chapter to the NIPA handbook outlining its methodology for calculating net interest payments in GDI: https://www.bea.gov/resources/methodologies/nipa-handbook/pdf/chapter-14.pdf
- 3 ^ See Tina Highfill, “Better Reflecting Transitions in Market Production by Government Functions Over Time: Updating the Classification of State and Local Government Enterprises in the National Income and Product Accounts,” BEA Working Paper WP2022-8.
Investors should consider this report as only a single factor in making their investment decision. For Reg AC certification and other important disclosures, see the Disclosure Appendix, or go to www.gs.com/research/hedge.html.