We expected and indeed received a large “January effect” in last week’s price data, with CPI and PPI both surprising consensus to the upside. In our view, the bigger surprise was the 0.56% spike in owners’ equivalent rents (OER), which outperformed the primary rent measure by the most since 1995. In this edition of the Analyst, we explore the scope for OER to continue to outperform and the implications of the January price data for the inflation and policy outlook.
In principle, the rebound in the single-family housing market and the unaffordability of homebuying could drive a positive wedge between OER and rent growth. Exploring this possibility using Zillow, Yardi, and Corelogic data, we find that the outperformance of single-family rent growth is fairly moderate—around +2pp annualized—and we estimate that this gap explains less than a quarter of the January OER spike. Simply put, January OER rose 7% in annualized terms but single-family rent growth is running at less than half that pace. We also do not find a clear relationship in the city-level cross section between January OER and single-family home price appreciation.
We believe single-family housing strength is a reason to expect OER to outperform rent CPI this year, but by nowhere close to 20bp per month. We assume a 4bp monthly boost to OER from this channel over the remainder of 2024, and we are boosting our December 2024 PCE housing inflation forecast by 0.4pp to 4.3% (yoy).
We are not too concerned about the strength elsewhere in the January CPI and PPI reports. January price changes tend to be cyclical and volatile—what we call the “January effect”—and usually, sequential inflation slows back down in February. We had already assumed a January effect in healthcare—where the lag between costs and prices is particularly long. Additionally, 3- and 6-month trimmed inflation remained rangebound in January, despite a boost from the January effect. Taken together, we are boosting our 2024 core PCE forecast only modestly, by 0.1pp to 2.3% (December yoy).
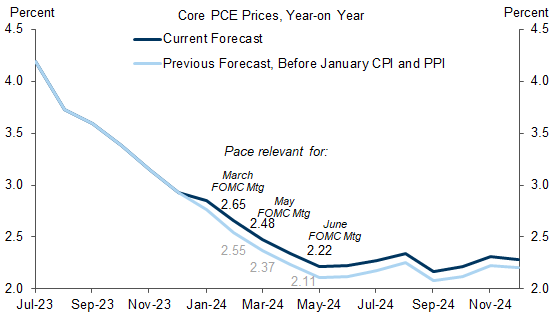
The January FOMC statement indicates that rate cuts will likely commence once inflation is moving sustainably toward 2%. If inflation evolves as we expect, core PCE inflation would fall to 2.5% at the time of the May meeting, and participants would likely anticipate further declines over the next two months given the high base effects in mid-2023. Accordingly, we continue to forecast five 25bp cuts in the Fed funds rate this year, with the first cut at the May meeting. This being said, last week’s price data raise the stakes for the February CPI and PPI reports to confirm that the January jump in OER and non-housing services were both temporary.
OER You Serious?
A Spike in OER
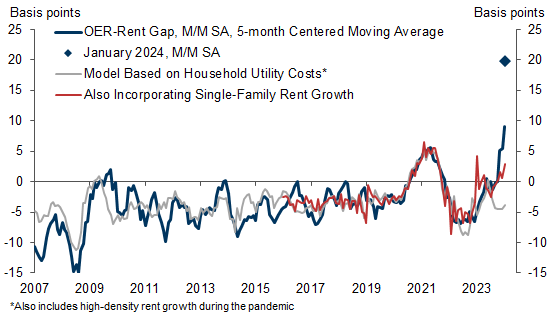
Exhibit 1: The January OER-Rent Gap Was the Largest Since 1995
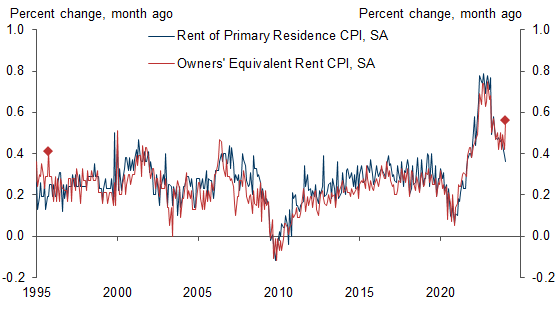
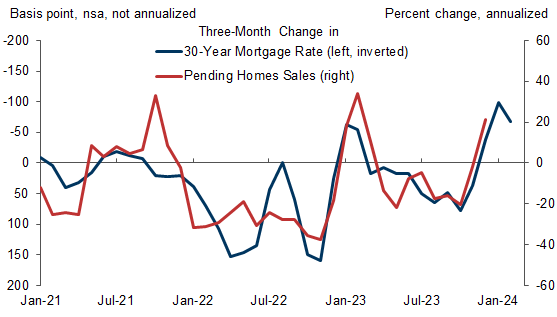
Exhibit 2: The Housing Market Is Starting to Rebound
Alternative Data on Single-Family Rents
Exhibit 3: But Single-Family Rent Growth Is Not Strong by Any Measure
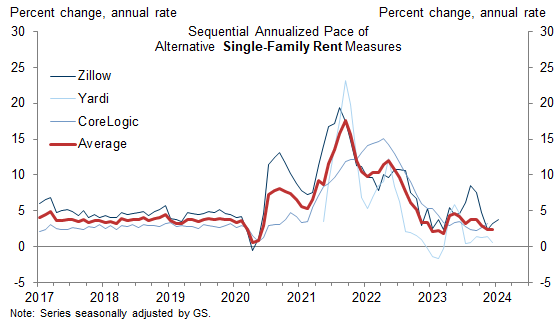
Exhibit 4: The January Surge in OER Was Led by an Acceleration in Smaller Cities
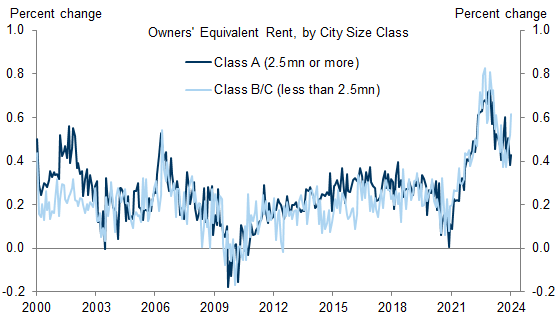
Exhibit 5: But the Housing Market Has Been Cooler in Smaller Cities
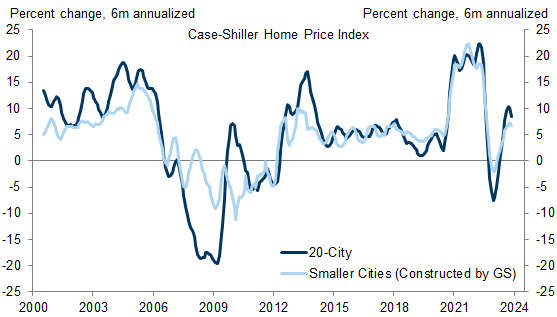
Exhibit 6: Moderate Outperformance of Single-Family Rent Growth
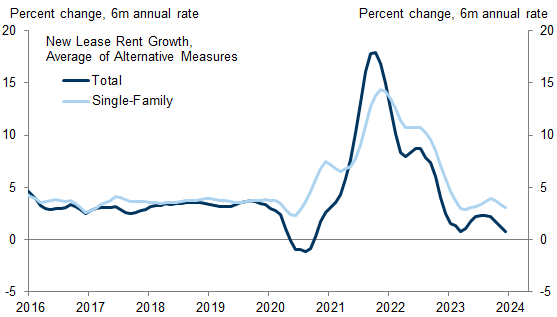
Exhibit 7: We Estimate That Single-Family Outperformance Explains Less than a Quarter of the January OER Spike
Non-Housing Services Inflation and the January Effect
Exhibit 8: January Inflation Readings Tend to Be Cyclical and Volatile, Because Firms Implement Start-of-Year Price Increases to Reflect the Prior Year’s Cost Environment
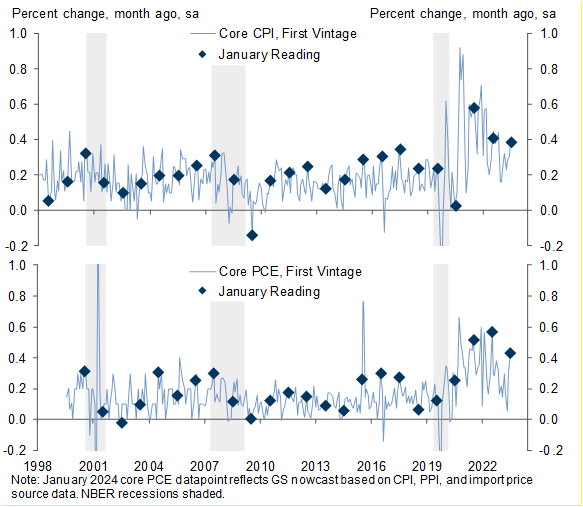
Exhibit 9: The Strength in Healthcare Prices Was in Line With Our Assumptions and in Our View Represents a Catchup to the 2023 Cost Environment
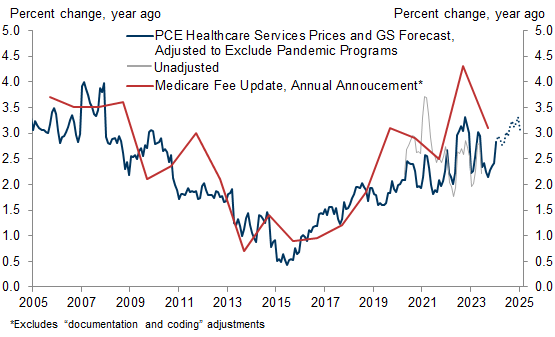
Exhibit 10: The Continued Rebalancing of the Labor Market Also Suggests that the January Rebound in Services Inflation Will Prove Temporary
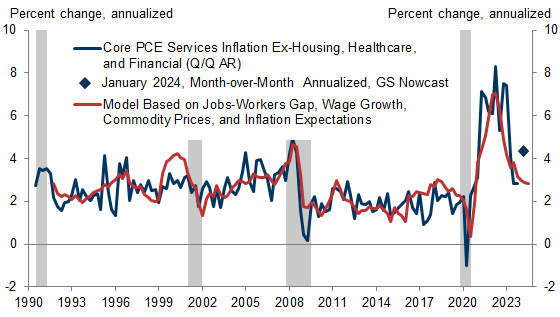
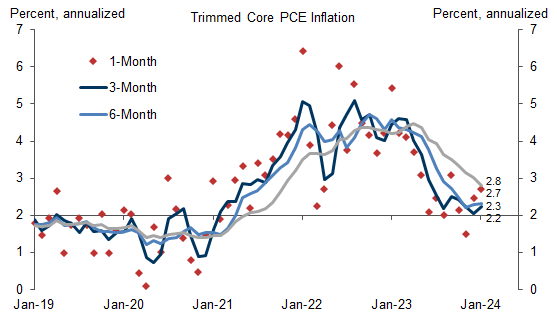
Exhibit 11: Trimmed Inflation Trend Remains Rangebound, Despite the Boost from the January Effect
Fed Implications
Exhibit 12: The 2024 Inflation Path Looks Slightly Stronger After Last Week’s Price Data
Spencer Hill
Ronnie Walker
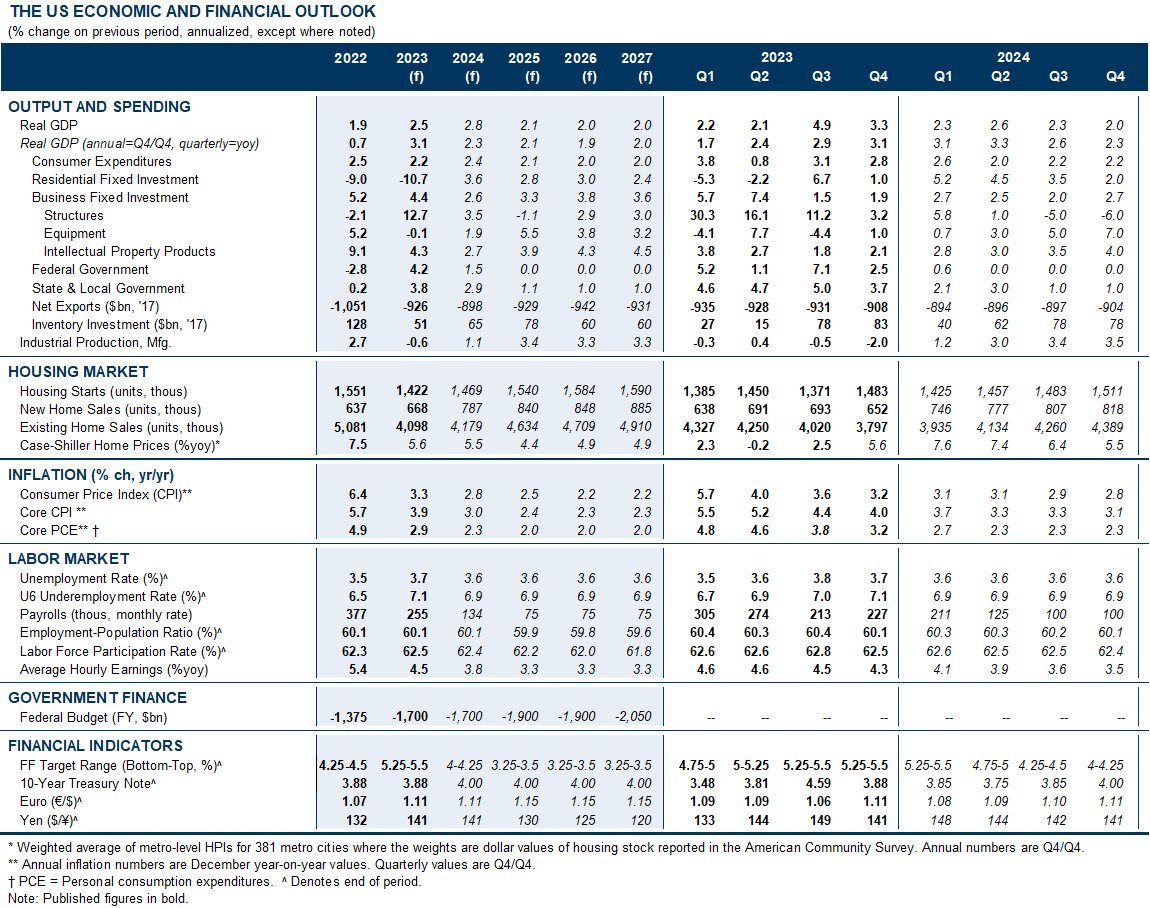
The US Economic and Financial Outlook
- 1 ^ If the recent rebound in the housing market were behind the acceleration in OER, we would expect the impact to first show up in the price of new leases, and especially in the price of new leases for single-family rentals—which are a closer substitute to owner-occupied housing and are heavily weighted in OER. As discussed in earlier reports, the official CPI measure of OER only sees a gradual feed-through from higher market rates because it covers rents on both new leases and continuing leases for existing tenants. The latter usually adjust more gradually, both because landlords are reluctant to alienate and lose tenants by raising their rent too abruptly and because the cost of moving reduces the risk that tenants will move out when market rents decline more quickly than their own, which is especially the case for single-family rentals.
- 2 ^ We also include a proxy for urban flight during the pandemic: rent growth in high-density urban areas, which generally underperformed in 2020-2021.
- 3 ^ We estimate between 3bp and 5bp of the +20bp OER outperformance in January can be explained by single-family rent growth, depending on whether the model is estimated in one or two stages.
- 4 ^ This reflects the particularly large weight of OER in the CPI, as well as scope for apparel prices to normalize to the upside. We continue to expect the Fed’s preferred measure—core PCE—to round to +0.2% in both of those months (mom sa).
- 5 ^ We found that price changes for some goods and services are 50-100% more volatile in January—and that price and wage adjustments in January often reflect the changes in the economic environment that took place over the previous year.
- 6 ^ When the core CPI or core PCE accelerates in January by at least 5bp relative to the six-month average, it steps back down in February by at least that 5bp 55% and 62% of the time, respectively. The median retracement—inclusive of instances of further acceleration—is 42% and 55%, respectively. For February 2024, we expect an even larger retracement because of the possible outlier reading for January OER.
- 7 ^ We estimate a 0.32% increase in the PCE healthcare services component in January (mom sa).
- 8 ^ Leading indicators of healthcare inflation have started to slow, including a smaller increase in Medicare fee schedules (red line in Exhibit 9) and a 44% retracement of the healthcare jobs-workers gap: 5.5% of the healthcare labor force in Q4, down from 7.2% at the peak and compared to 3.4% pre-pandemic. Additional, hourly earnings growth for the sector has fallen back below 3% (+2.9% yoy in January vs. +7.2% at the peak and +2.2% in 2019).
- 9 ^ We exclude financial services prices as they depend much more on asset prices than on the labor market and cost environment.
- 10 ^ The January effect should also manifest itself in trimmed measures of inflation, some of which unsurprisingly picked up in January. Furthermore, year-on-year trimmed inflation—which incorporates the size of this year’s January effect relative to that of the prior year—continued to decline. This is consistent with our forecast of a smaller January effect in 2024 and in our view indicates continued progress on disinflation more broadly.
Investors should consider this report as only a single factor in making their investment decision. For Reg AC certification and other important disclosures, see the Disclosure Appendix, or go to www.gs.com/research/hedge.html.