Norges Bank’s Monetary Policy Committee held the policy rate at 4.5% at its August meeting, reiterating its reluctance to lower policy rates soon. However, it pointed out that "if prospects suggest that inflation will return to target faster than projected in June, the policy rate may be lowered earlier than previously envisaged". We thus take a close look at core inflation (CPI-ATE) and its drivers using a “thick modelling” approach, which estimates a large number of different specifications.
Given Norges Bank’s emphasis on wage growth as a key driver of inflation, we start by assessing the wage outlook by estimating a range of wage Phillips curves for Norway. We find that slowing growth, increasing slack and receding inflation expectations point to a somewhat faster cooling in pay growth than Norges Bank forecasts (at 4.9% vs 5.2% in 2024 as a whole).
Turning to inflation, we find that services inflation tends to be best explained by wage growth, inflation expectations, and domestic activity. Imported goods inflation loads on the exchange rate, global inflation, and gas prices. We expect rent inflation to exhibit some stickiness in the near term. However, decelerating services ex. rent and imported goods inflation leave our core inflation forecast at 3.2% by year-end, below Norges Bank’s 3.5% projection.
In a final step, we attempt to replicate Norges Bank’s policy rate path model to gauge the implications for the rate outlook, which considers prices and wages, inflation expectations, domestic demand and other factors. Under our forecast for wage growth and inflation, the model points to two rate cuts this year. But using Norges Bank’s higher wage and core inflation forecast implies a more hawkish rate path with just one rate reduction this year.
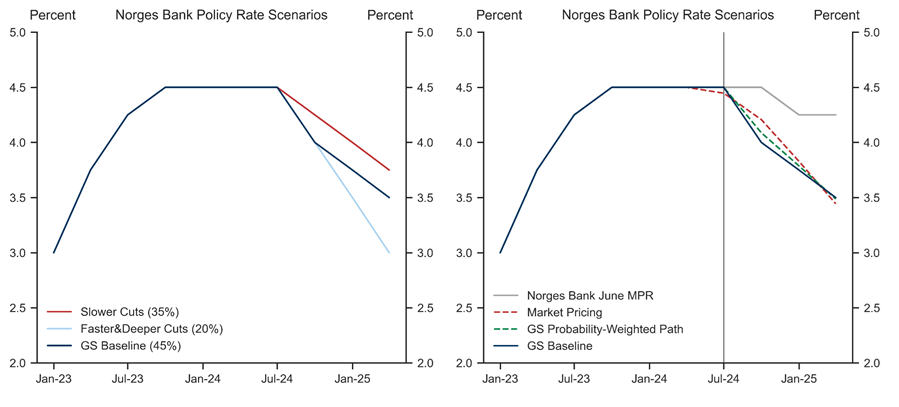
Our analysis therefore supports our forecast for two 25bp cuts this year (November and December), contingent on inflation and wage growth developing in line with our projections. We expect Norges Bank to make quarterly 25bp cuts thereafter to a terminal rate of 3% in 2025Q4.
That said, the rate outlook is quite uncertain, and we set out a number of alternative policy scenarios. We assign a 45% probability to our baseline with two cuts this year, followed by quarterly cuts. We see the risks as skewed towards less easing, however, with a 35% chance of slower cuts and a 20% probability of faster easing. Nonetheless, our baseline and probability-weighted paths are notably below both Norges Bank’s policy rate path and market pricing over the next six months.
Norway — The Case for Cuts
Exhibit 1: Inflation Has Undershot Norges Bank’s Projections, with Underlying Inflation Consistently Lower
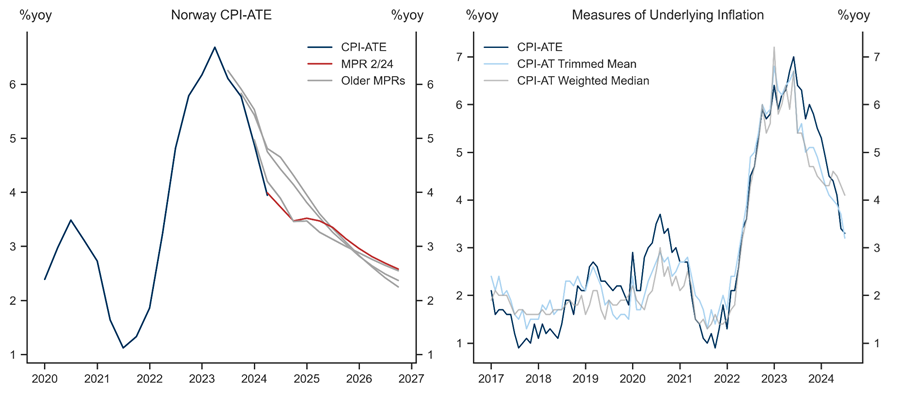
Exhibit 2: Subdued Activity Picture And a Build-up in Slack
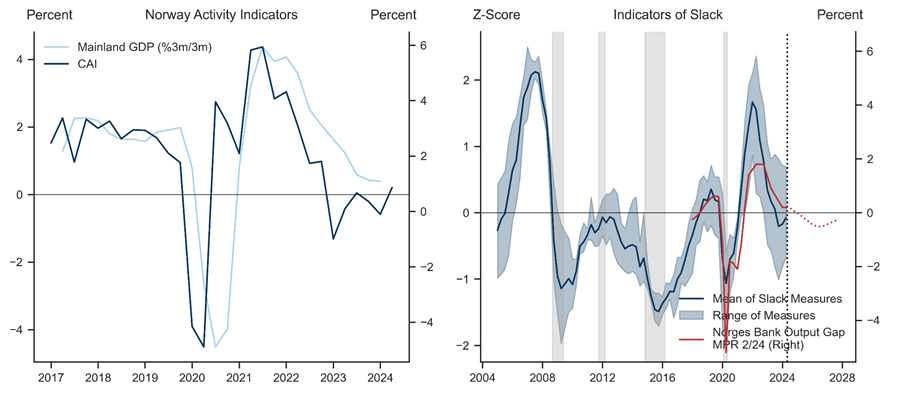
Exhibit 3: Labour Market Weakening, Amid a More Benign Wage Outlook
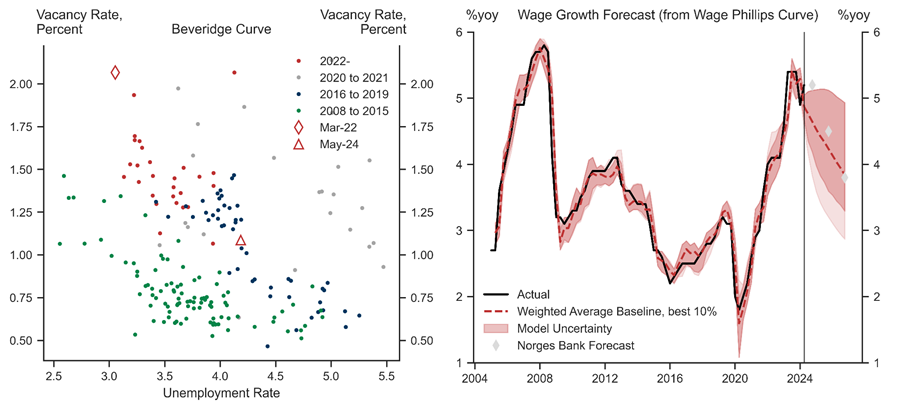
Exhibit 4: Services Inflation Has Driven Core Inflation Recently
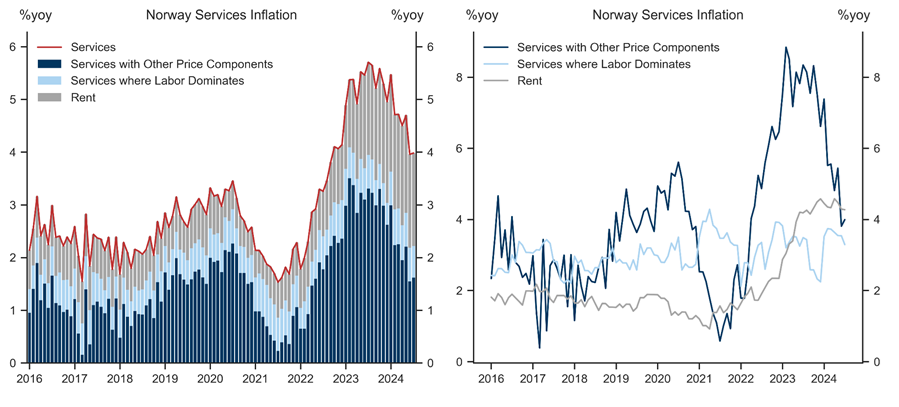
Exhibit 5: Rent Inflation Still Sticky But Falling on Rates Cuts and Slower Wage Growth
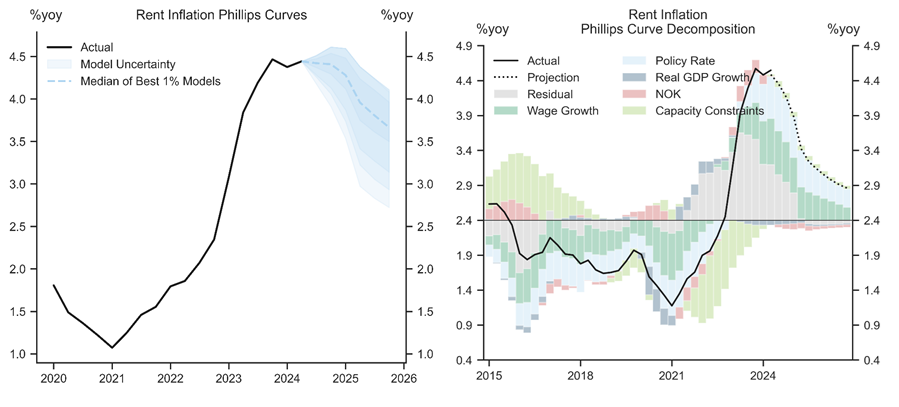
Exhibit 6: Other Services Inflation Decelerating Due to Lower Inflation Expectations And Global Inflation
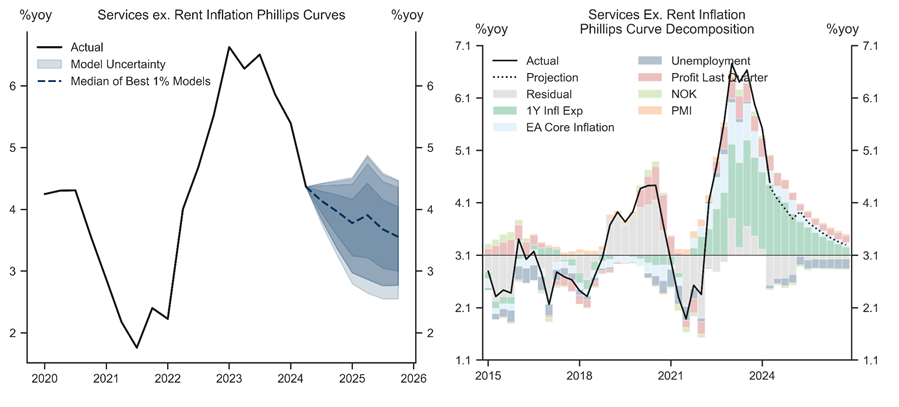
Exhibit 7: Goods Inflation Substantially Lower, Especially for Imported Goods
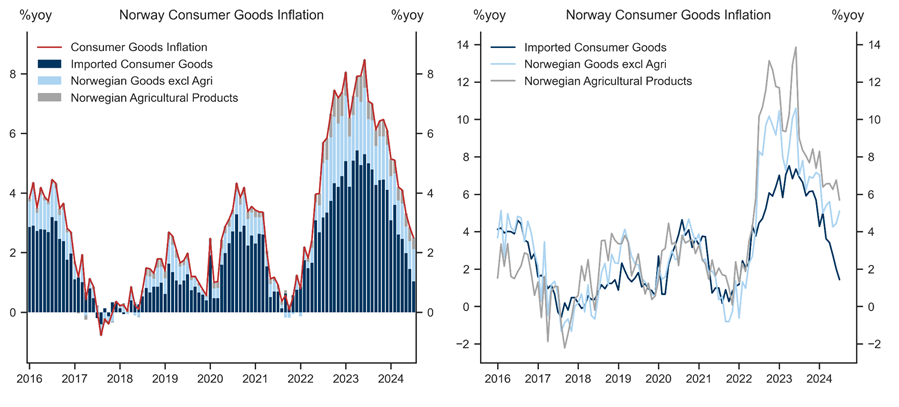
Exhibit 8: Imported Goods Inflation on a Clear Downward Trajectory, But the Outlook for FX is Key
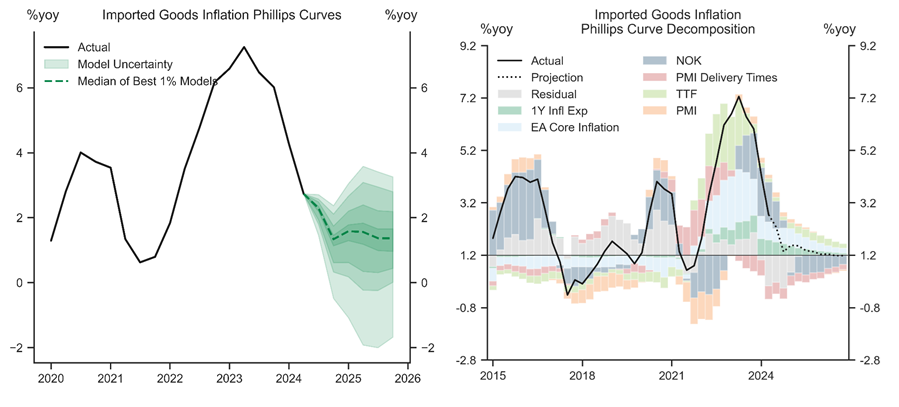
Exhibit 9: Inflation to Slow Faster than Norges Bank Projects, Pointing to More Cuts
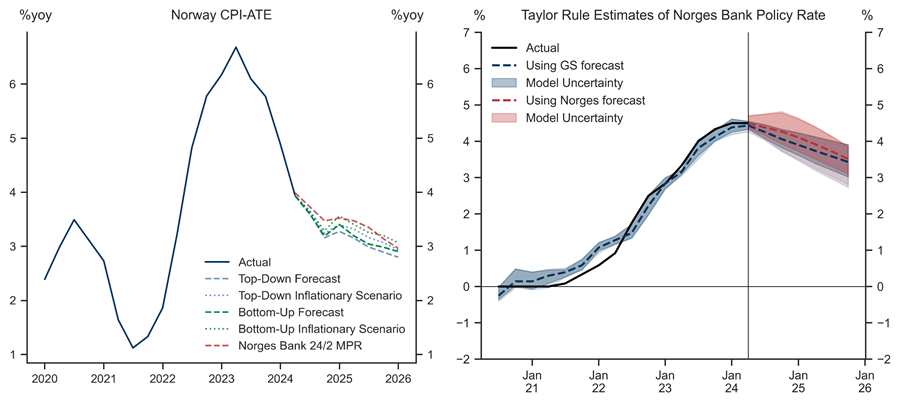
Exhibit 10: Our Forecast Is Below Market Pricing in the Medium Term
- 1 ^ Which tends to be highly correlated with the “wage norm” series and is available on a quarterly basis.
- 2 ^ In-sample fit is defined through adjusted R-2. The results are robust to using different estimation horizons, including the sample ending in 2019Q4.
- 3 ^ Since Norges Bank publishes some of the aggregates from 2015 onwards, due to series rebasing, we utilize discontinued series, specifically for Norwegian consumer goods, to reconstruct the longer series.
- 4 ^ We use fitted values and forecast from the Wage Phillips curve to avoid breaks in the series.
- 5 ^ We again use our own forecasts and simple models, such as Okun’s law, to project the majority of explanatory variables. In addition, we utilize the gas and oil forwards, and Norges Bank’s inflation forecasts to project inflation expectations, and adopt their import-weighted exchange rate projections from the June report. We then rank the models based on their in-sample fit, and record the occurrence of the variables picked up by the best-performing models out of over 3000 estimated for each variable.
- 6 ^ The best-performing models tend to load on wage growth, domestic activity, the unemployment rate, capacity utilization and the exchange rate.
- 7 ^ The baseline forecast takes the FX forecast from Norges Bank’s June projections, with the “inflationary scenario” assuming it stays at the July value of 120.
Investors should consider this report as only a single factor in making their investment decision. For Reg AC certification and other important disclosures, see the Disclosure Appendix, or go to www.gs.com/research/hedge.html.