Goldman Sachs Research
Global Strategy Views
Diversify to Amplify
Table of Contents
14 October 2024 | 5:05AM BST | Research | Portfolio Strategy| By Peter Oppenheimer and others
More
  • We are entering a more benign part of the cycle with a continuation of economic growth alongside lower policy rates – a combination that has historically been positive for equities.

  • Longer-term rates are unlikely to fall given a rebuild of term premia and higher government deficits. This, together with high US equity valuations, moderates the upside in equities at the index level.

  • This means that alpha should become a more important driver of returns with a broadening opportunity set within and across equity markets.

  • There is a growing symbiotic relationship between the potential for the Technology sector and growth in some parts of the ‘old economy’ as the needs for capex rollout and electrification increase.

  • The prospects for equity returns are no longer a function of whether the sector is classified as Growth or Value; it can be a bit of both.

  • We look for opportunities to improve risk-adjusted returns through more regional diversification. We expect broadening market participation with Mid caps in the US, ETCs (ex Tech compounders) and selective Value compounders.

Where are we headed?

1. Following the past couple of years of high inflation and interest rates, we are entering a more benign stage of the economic cycle. The prospects for continued global growth remain positive and our economists have reduced their implied US recession probability to 15% over the next 12 months – in line with the unconditional average. This cycle is also evolving in a more ‘typical’ way relative to the post fiscal crisis cycle with its sub-trend growth and zero interest rates (Exhibit 1). In comparison, while economic activity in other regions remains weaker, our economists forecast global real GDP growth of 2.7% in 2025 (similar to the past couple of years).

Exhibit 1: This cycle is evolving in a more ‘typical’ way relative to the post fiscal crisis cycle

US Real GDP indexed to 100 at start of recession, defined by NBER
1. This cycle is evolving in a more ‘typical’ way relative to the post fiscal crisis cycle. Data available on request.
Source: Haver Analytics, Goldman Sachs Global Investment Research
Meanwhile, most G10 central banks have commenced a journey of steady interest rate cuts, and China has also eased monetary policy aggressively.
2. From an equity market perspective, the impact of a rate-cutting cycle has varied depending, largely, on the economic cycle. A combination of continued economic growth with a rate-cutting cycle tends to be positive for global equities (Exhibit 2). It is only when a recession follows the interest rate cuts that equities usually underperform. Our view is that the global economy and corporate profits will continue to grow through 2025 while interest rates will be trending lower; this combination suggests the broad backdrop for equities should be positive.

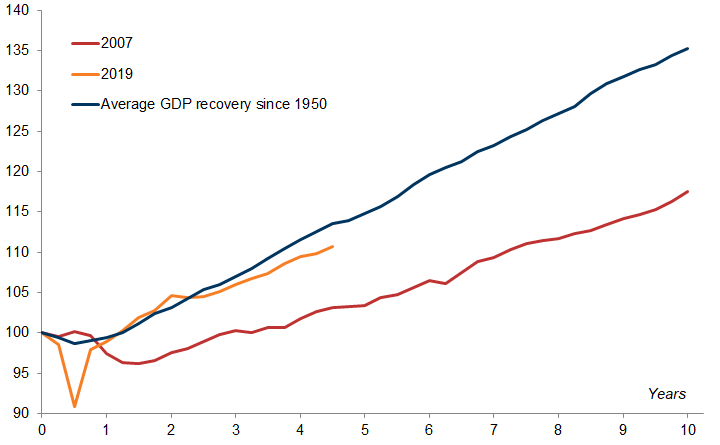
Exhibit 2: A combination of continued economic growth with a rate-cutting cycle tends to be positive for global equities

Global equities around Fed cut with and without recession
2. A combination of continued economic growth with a rate-cutting cycle tends to be positive for global equities. Data available on request.
Source: Datastream, Goldman Sachs Global Investment Research
3. Nevertheless, while the cyclical conditions for equities are supportive, there are structural factors that are likely to constrain the aggregate progression of index returns. This means that alpha should become a more important driver of returns with a broadening opportunity set within and across equity markets. One of the structural dynamics at play is that government debt levels are high and often rising. As Exhibit 3 shows, the Debt-to-GDP ratio for the Developed Markets is at the highest level for many decades, while Emerging Markets are also seeing rising debt.

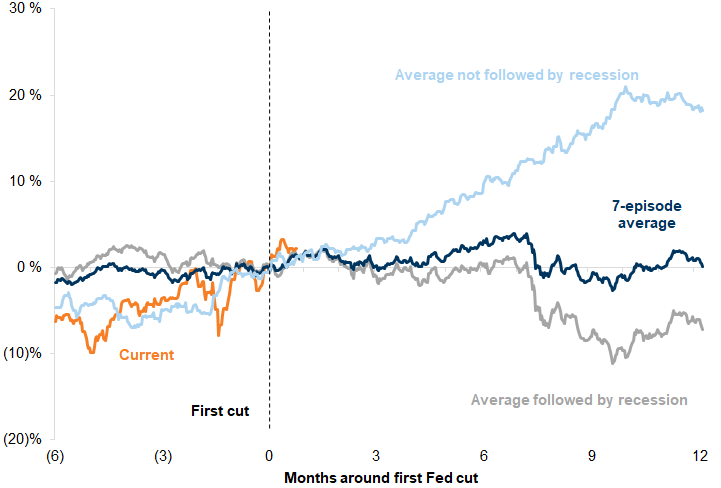
Exhibit 3: One of the structural dynamics at play is that government debt levels are high and often rising

IMF general government debt (% of GDP) projections
3. One of the structural dynamics at play is that government debt levels are high and often rising. Data available on request.
Source: IMF, Goldman Sachs Global Investment Research
This, together with rising term premia, suggests that while short-term interest rates will fall, longer-term interest rates are unlikely to come down (Exhibit 4).

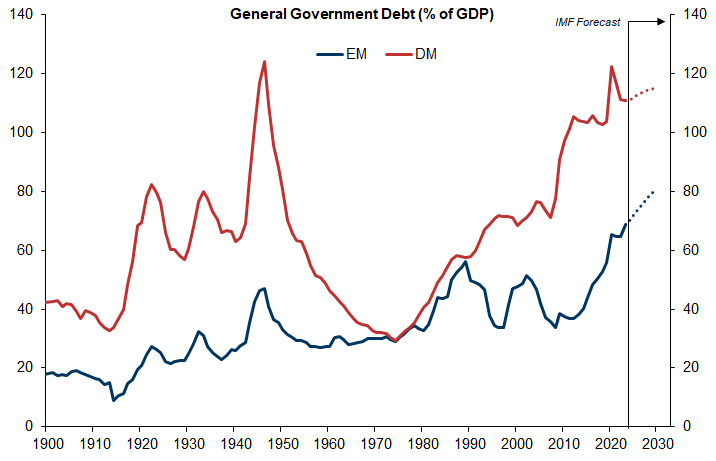
Exhibit 4: Longer-term interest rates are unlikely to come down

10-Year Bond Yield, GS Forecast (%)
4. Longer-term interest rates are unlikely to come down. Data available on request.
Source: Datastream, Haver Analytics, Goldman Sachs Global Investment Research
4. 'Higher for longer' bond yields can cap the upside potential for broad equity indices as the Equity Risk Premium has fallen back to the low levels seen in the early part of this century (Exhibit 5).

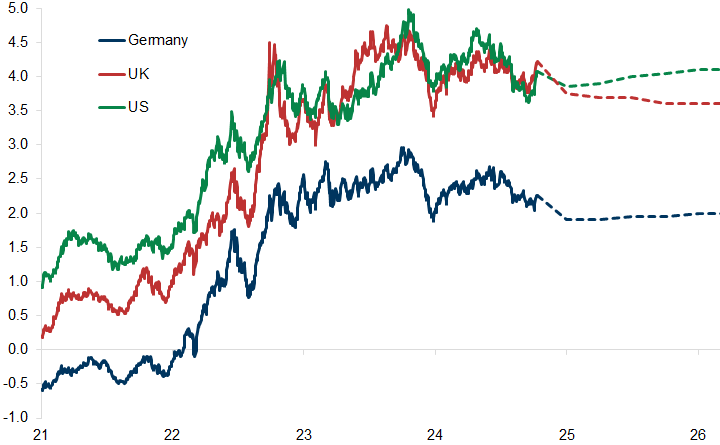
Exhibit 5: Equity Risk Premium has fallen back to the low levels seen in the early part of this century

Global market implied ERP (%)
5. Equity Risk Premium has fallen back to the low levels seen in the early part of this century. Data available on request.
Source: Goldman Sachs Global Investment Research
At the same time, equity index valuations, at least in the US market, are at the top of their longer-term range. Exhibit 6 shows a simple comparison of P/E ratios based on consensus 12m forward earnings estimates. Certainly, part of the US premium can be explained by the higher valuations of the dominant Tech companies, but the exhibit shows that the market is still on a high valuation even excluding these companies. While our US strategists argue that these valuations are in line with their macro model of fair value, most of the return for the US market is likely to come from earnings over the next couple of years. Stronger growth has prompted our US team to upgrade their forecasts for the S&P 500 EPS to $268 (+11% year/year) from $256 (+6%) and introduce a 2026 EPS estimate of $288 (+7%). Their 12-month target, now at 6300 (from 6000), implies 10% upside over the next year.

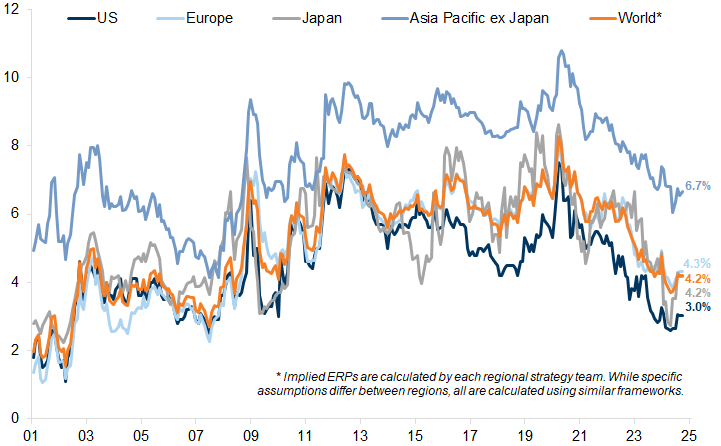
Exhibit 6: At the same time, equity index valuations in the US market are at the top of their longer-term range on other valuation metrics

12m fwd P/E multiple. MSCI Regions. Data for the last 20 years
6. At the same time, equity index valuations in the US market are at the top of their longer-term range on other valuation metrics. Data available on request.
Source: FactSet, Goldman Sachs Global Investment Research
5. Other equity markets are trading in line with their historical averages, but look much cheaper relative to their bond markets and the US. This relative discount has been true for most of the past decade and, while the US has consistently outperformed, this has been explained by its superior profit growth (Exhibit 7).

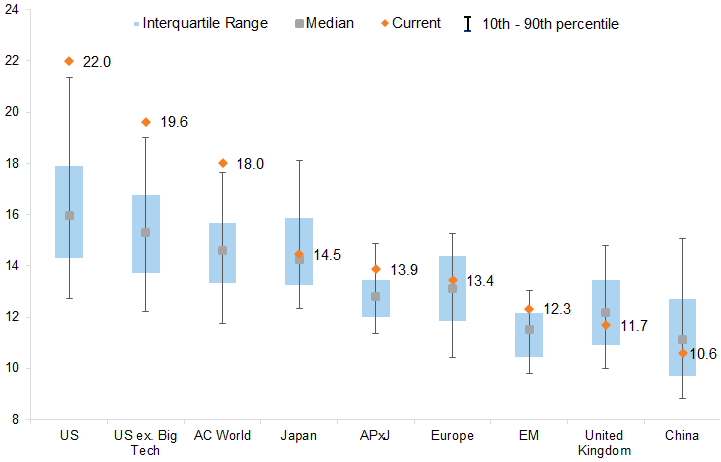
Exhibit 7: While the US has consistently outperformed, this has been broadly explained by relative profit growth

Price return and 12m fwd EPS in local currency. Indexed to 100 in Jan-14
7. While the US has consistently outperformed, this has been broadly explained by relative profit growth. Data available on request.
Source: Datastream, Goldman Sachs Global Investment Research
Nevertheless, looking forward, the gaps in growth rates of EPS across the major regions is narrowing. This is not a good reason to underweight the US, but rather to selectively look at undervalued opportunities in other markets to increase diversification and enhance risk-adjusted returns. Only Europe continues to lag in terms of profit growth prospects (Exhibit 8), reflecting both a weaker economic backdrop and sector composition.

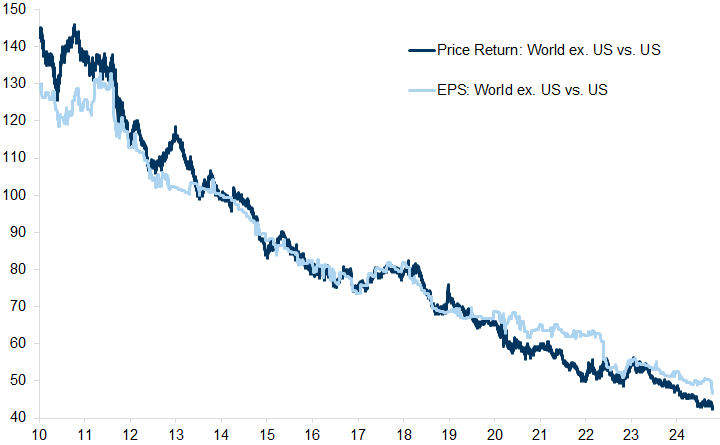
Exhibit 8: Only Europe continues to lag in terms of profit growth prospects

GS top-down vs. consensus bottom-up estimates of 2025 EPS growth
8. Only Europe continues to lag in terms of profit growth prospects. Data available on request.
Source: I/B/E/S, Toyo Keizai, STOXX, MSCI, Goldman Sachs Global Investment Research
This is not a good reason to underweight the US; a comparison of the P/E to expected earnings growth (Exhibit 9) suggests that the US equity market continues to justify its premium valuation.

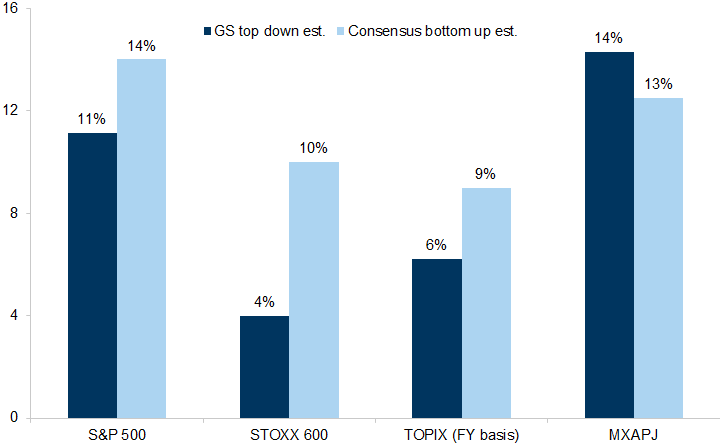
Exhibit 9: Big discounts in Europe might suggest hidden value in some places

PEG ratio (12m fwd P/E divided by second 12m EPS growth)
9. Big discounts in Europe might suggest hidden value in some places. Data available on request.
Source: Datastream, Goldman Sachs Global Investment Research
Global fund flows have strongly favoured the US, however, at the expense of other markets (for good reason), and there remain some relative discounts in the other markets, suggesting that there are at least some selective opportunities to broaden exposure to enhance risk-adjusted returns.

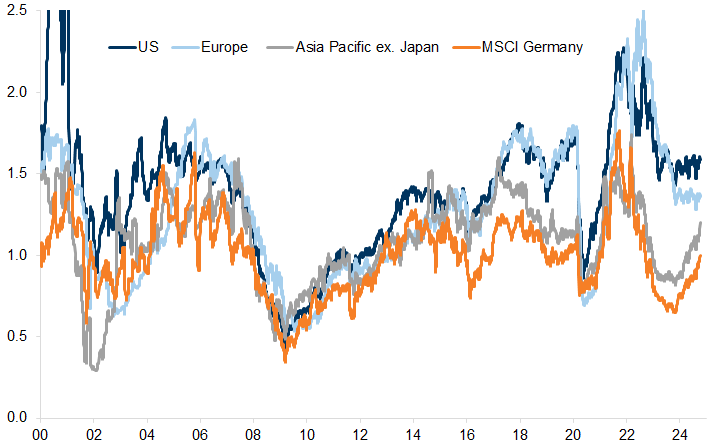
Exhibit 10: Portfolio investments held in US assets (equity and debt securities) are at a peak

10. Portfolio investments held in US assets (equity and debt securities) are at a peak. Data available on request.
Includes equity and investment fund shares, and total debt securities (long-term plus short-term debt securities).
Source: International Monetary Fund, Haver, Goldman Sachs Global Investment Research
6. The China policy stimulus has improved the prospects for China equities, notwithstanding the powerful rally they have staged. Despite significant structural issues (the property market, demographics, debt levels, low domestic consumption, geopolitical tensions), valuations remain relatively attractive (11.3x P/E) given there is some upside risk to earnings (see Asia-Pacific Portfolio Strategy: China changes the game, 5 October 2024). Our Asia strategists estimate a further 15-20% potential upside in China from current levels and have upgraded their MXAPJ 12m index target to 690 (previously 630), implying a 16% USD total 12m return. Similarly, the EM team upgraded their MSCI EM target to 1,300. In Japan, we think the recent correction offers a better entry point. Our 12-month TOPIX target remains at 2,900, with 16% USD total return potential upside, driven by solid EPS growth and some valuation expansion, with particular opportunities in domestic demand stocks, small/mid caps, and quality Growth stocks.
In Europe, while earnings growth remains lacklustre, selective opportunities for diversification exist within a global portfolio. On a sector comparison, stocks in Europe trade on much bigger discounts than they have typically done in the past (Exhibit 11). This is not a good reason to be overweight the index, but suggests hidden value in some areas (Exhibit 9), both in globally positioned growth compounders (Technology and Healthcare, for example), as well as in selected Value areas of the market, such as Banks, where shareholder returns are rising. Overall, we continue to see benefits from international diversification and remain Neutral across regions on a 12m horizon – for 3m, we are OW US and Asian equities, N Japan, and UW Europe. See GOAL: Global Opportunity Asset Locator: From rates to growth - pro-risk with hedges into year-end also published today.

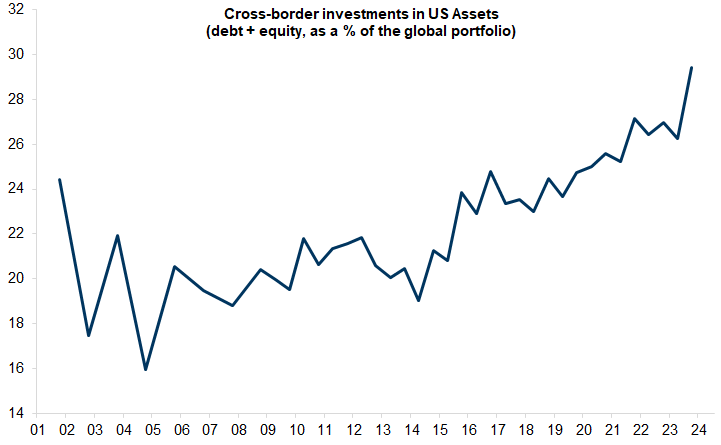
Exhibit 11: On a sector comparison, stocks in Europe trade on much bigger discounts than they have typically done in the past

Europe vs. US 12m fwd P/E Premium/(Discount). Data for last 20 years
11. On a sector comparison, stocks in Europe trade on much bigger discounts than they have typically done in the past. Data available on request.
Source: Datastream, Goldman Sachs Global Investment Research
7. The motivation for diversification is also being driven by the increased concentration at the sector level. The Technology sector has diverged meaningfully from the performance of other sectors since 2010, justified by its prolonged trend of superior profit growth (Exhibit 12).

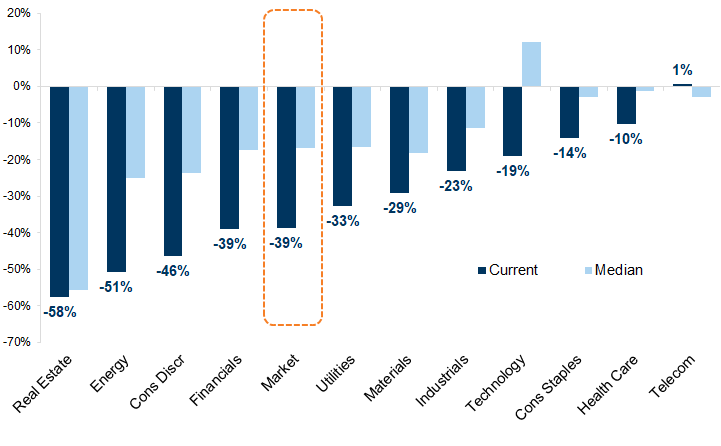
Exhibit 12: Just as the US equity market outperformance has reflected stronger fundamentals, so too has the Technology sector

12m Trailing EPS (USD). Indexed to 100 on Jan-2009
12. Just as the US equity market outperformance has reflected stronger fundamentals, so too has the Technology sector. Data available on request.
Source: Datastream, Worldscope, Goldman Sachs Global Investment Research
More recently, however, the increasing focus on AI has revealed the growing physical constraints to future growth that this industry faces with its reliance on the roll-out of data centres and on progress towards electrification. Consequently, for the first time for many years, there is a symbiotic relationship between the potential for the Technology sector and growth in some parts of the ‘old economy.’ The prospects for equity returns are no longer a function of whether the sector is classified as Growth or Value; it can be a bit of both.
8. The other challenge for investors is that many equity markets have become increasingly concentrated at the stock level. This is most obvious in the US, where the biggest 10 companies account for around just under 20% of the value of the global equity market (Exhibit 13), and the top 5 companies roughly 15%.

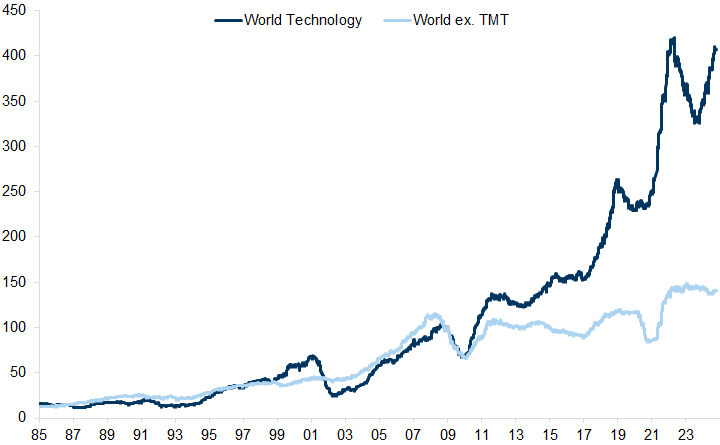
Exhibit 13: In the US the biggest 10 companies account for around 18% of the value of the global equity market

Weight of biggest US companies in global market cap
13. In the US the biggest 10 companies account for around 18% of the value of the global equity market. Data available on request.
Source: Datastream, Goldman Sachs Global Investment Research
Once again, just as with the outperformance of the US equity market and the Technology sector, this increased concentration has reflected extraordinary profit growth rather than speculative exuberance (Exhibit 14).

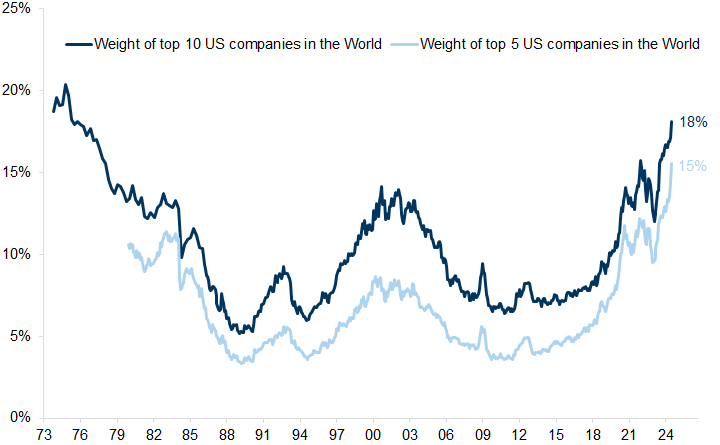
Exhibit 14: This increased concentration has reflected extraordinary profit growth rather than speculative exuberance

Magnificent Seven and S&P 500, 12m trailing EPS
14. This increased concentration has reflected extraordinary profit growth rather than speculative exuberance. Data available on request.
Source: Datastream, Goldman Sachs Global Investment Research
Encouragingly, the valuations of large cap Technology remain much lower than we have seen in previous bubble periods (such as the late 1990s Technology bubble, Japan in the late 1980s or the 'Nifty Fifty' bubble of the early 1970s). However, many of the dominant Technology companies are shifting away from their capital-light, highly scalable business models and are increasingly capital-heavy (see Global Strategy Paper: AI, to buy or not to buy, that is the question, 5 September 2024). There is rising uncertainty over whether these companies can generate the future returns on these investments that is reflected in their current valuations. History suggests that the companies that build the underlying infrastructure in technology revolutions are often not the main beneficiaries (think of the Telecom companies during the late 1990s compared with the app-based businesses that emerged later and were able to benefit from the capex that had been built and paid for by others). The balance sheets and margins of the dominant companies, together with their competitive 'moats', auger well for their ability to sustain good compound returns. However, there is a greater chance that other companies, which can leverage the capex that the pioneers have installed, will be able to grow at a faster rate in the future.
9. With the prospect of positive but slower equity index returns, we continue to focus on ways for investors to enhance risk-adjusted returns through diversification and a focus on compounding over time – either through quality Growth companies that reinvest at a high rate, or through Value companies that are able to compound shareholder returns through a combination of buybacks and dividend growth. Such an eclectic mix would mark a departure from the trends that have dominated since the financial crisis. In the post financial crisis decade, up until the start of the pandemic, asset returns were highly bifurcated; financial assets sharply outperformed real assets. Wages, real estate prices and inflation remained subdued; ever-lower interest rates boosted financial asset valuations and returns. The best-performing markets were long duration Growth assets – Technology, the Nasdaq, the ‘growth’ factor, and high yield credit. The worst-performing were either Value assets, or ‘real’ assets such as gold and commodities (Exhibit 15).

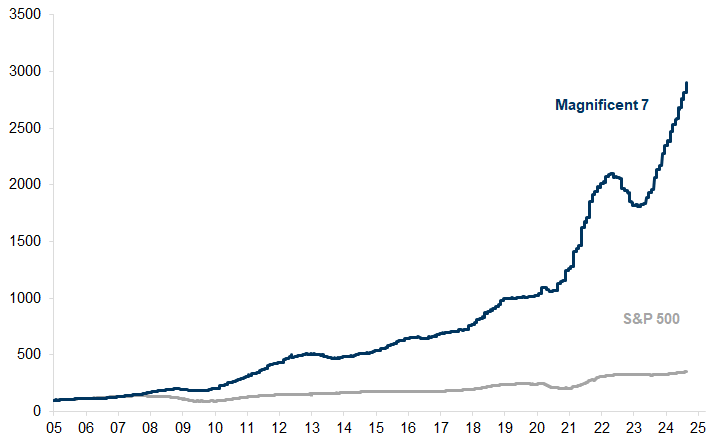
Exhibit 15: In the post financial crisis decade, up until the start of the pandemic, financial assets sharply outperformed real assets

Total return performance in local currency, Jan 2009 – Feb 2020
15. In the post financial crisis decade, up until the start of the pandemic, financial assets sharply outperformed real assets. Data available on request.
Source: Datastream, Haver Analytics, Goldman Sachs Global Investment Research
The pattern reversed in 2022 as global inflation and rising rates upended the relationships. Real asset prices outpaced financial assets (which de-rated under the weight of higher yields). The best-performing financial assets were Value-exposed – gold, commodities, and Japan – while the worst-performing were longer duration and Growth stocks (Exhibit 16).

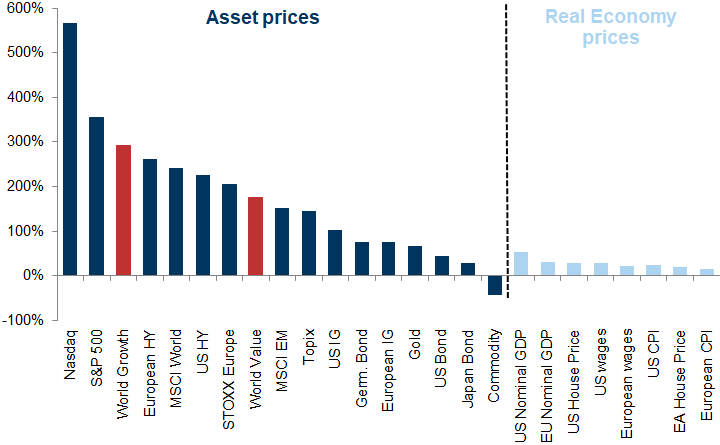
Exhibit 16: The pattern reversed in 2022 as global inflation and rising rates upended the relationships

Total return performance in local currency, Jan 2022 – Oct 2023
16. The pattern reversed in 2022 as global inflation and rising rates upended the relationships. Data available on request.
Source: Datastream, Haver Analytics, Goldman Sachs Global Investment Research
Since October 2023, when investors turned more optimistic of a 'Fed Pivot', the 'winners' have been a more eclectic mix (Exhibit 17). Gold has performed strongly alongside the Nasdaq and EM equities, while the gap between Growth and Value has narrowed. Bonds have performed poorly and real economy assets have lagged behind as inflation has started to moderate. Among the best-performing equities we have seen an unusual mix of Technology, Real Estate, Utilities and European Banks.

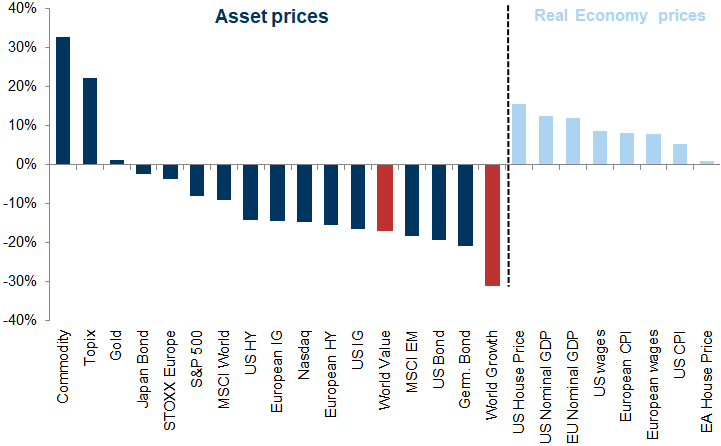
Exhibit 17: This year, the 'winners' have been a more eclectic mix

Total return in local currency since October 2023
17. This year, the 'winners' have been a more eclectic mix. Data available on request.
Source: Datastream, Haver Analytics, Goldman Sachs Global Investment Research
10. We currently favour several strategies to reflect this more eclectic market environment while also increasing diversification to enhance forward risk-adjusted returns. First, the Technology sector in the US has seen huge inflows year to date.

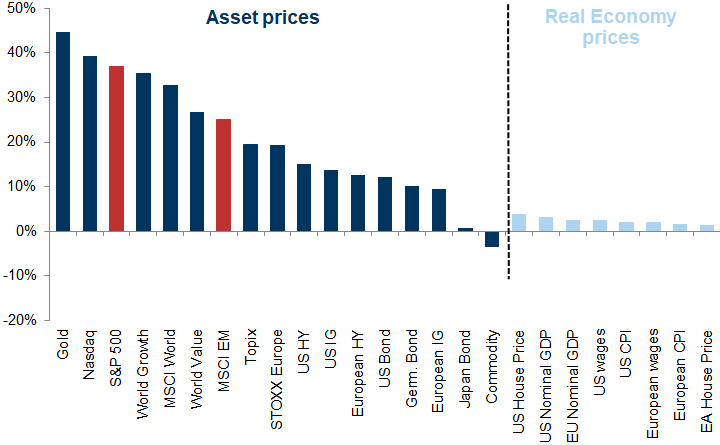
Exhibit 18: The largest inflows have been into US Tech funds with large outflows from Healthcare and Energy

YTD flows into US equity sector funds. Cumulative monthly flows + MTD sum of weekly flows for Sep-24 ($bn)
18. The largest inflows have been into US Tech funds with large outflows from Healthcare and Energy. Data available on request.
Source: EPFR, Haver, Goldman Sachs Global Investment Research
We think diversification to complement Technology makes sense. We identified a list of Ex Tech Compounders (ETCs). This list is well diversified across sector and regions. These companies share similar characteristics with the Big Tech, but without the idiosyncratic risks of heavy concentration or antitrust regulation. This list of ETCs have performed in line with Global Tech over the past three years, but have been less volatile, helping to boost the Sharpe ratio and mitigate risks as volatility picks up. Despite a premium, the valuation of these companies is in line with its average since 2016 and trades at the lowest premium to the world stock market since 2018 (Exhibit 19).

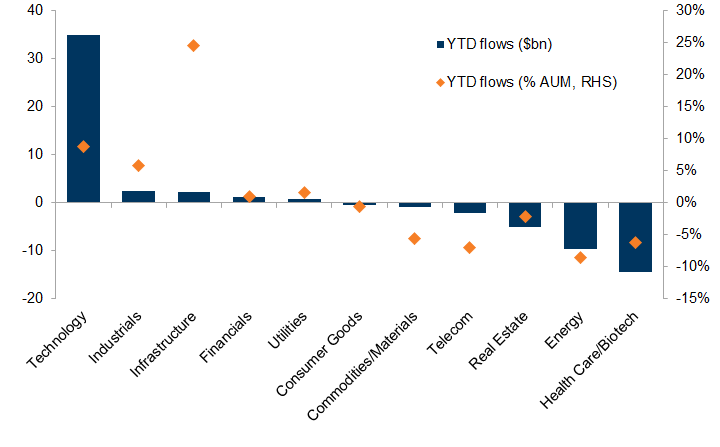
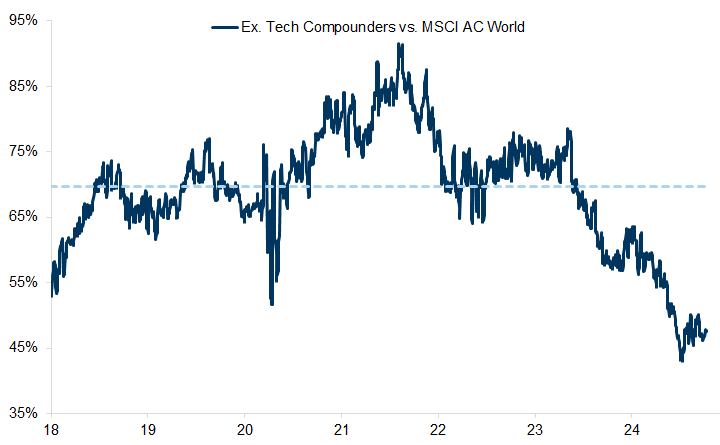
Exhibit 19: Our ETCs list trades at the lowest premium to the world stock market since 2019

12m fwd P/E premium
19. Our ETCs list trades at the lowest premium to the world stock market since 2019. Data available on request.
Source: Datastream, Worldscope, Goldman Sachs Global Investment Research
Second, in the US, our strategy team continues to focus on more market broadening with mid caps being in the 'sweet spot' of higher growth but with lower valuations and higher leverage than large caps, making them a bigger beneficiary of lower interest rates. Third, in Europe, we continue to prefer a selective ‘barbell’ approach between Growth stocks (such as Technology or Healthcare) and Value stocks (such as Banks and Telecoms). Fourth, in Asia, we like stocks that should benefit from the positive effects of China’s economic easing and equity rebound: our APJ China Sales Exposure basket (GSSZAPCN) and Defence stocks. Finally, given lingering risks into the year-end and an unpredictable political environment, we continue to favour hedging strategies, including put spreads on S&P 500/European equities, CDS payer spreads and USD HY TR puts (see GOAL Risk Keeper: Hedging equities into year-end: Balancing drawdown risk and cost, 5 September 2024).

Investors should consider this report as only a single factor in making their investment decision. For Reg AC certification and other important disclosures, see the Disclosure Appendix, or go to www.gs.com/research/hedge.html.