US Equity Views
Lowering our S&P 500 EPS and valuation forecasts as the "Maleficent 7" pushes the index to the brink of correction
1. From "Magnificent 7" to "Maleficent 7." During the past three weeks the S&P 500 index has plummeted by 9% from its all-time high with more than half of the near-correction stemming from a 14% plunge in the share prices of the Mag 7 stocks (P/E to 26x from 30x). In contrast, last year the Mag 7 stocks accounted for more than half of the 25% total return of the overall index. Note that during the past 40 years the cap-weighted index has experienced a median calendar year drawdown of 10%, similar to the recent fall. However, the typical stock as represented by the equal-weight index (SPW) has declined by 6% during the past three weeks (P/E to 16x from 17x) and trades 8% below its all-time high reached at the end of November. The proximate causes of the market decline are the jump in policy uncertainty largely related to tariffs, concerns about the economic growth outlook, and a positioning unwind, especially among hedge funds. In contrast, 61% of large-cap mutual funds have outperformed their benchmarks YTD.
2. Revised base case scenario: similar return from a lower level. We lower our 2025 year-end S&P 500 index target to 6200 (from 6500) to reflect a 4% reduction in our modeled fair-value forward P/E multiple (20.6x from 21.5x). Our new index target suggests an 11% price gain during the balance of the year, similar to our return estimate at the start of the year but from a lower starting point. We also trim our top-down 2025 EPS growth forecast to 7% (from 9%) but maintain our 2026 growth estimate of 7%. Our new EPS estimates are $262 (previously $268) and $280 ($288). Note that our earnings forecasts are below both consensus top-down (strategist) and bottom-up (analyst) estimates. Our revised estimates reflect the recently reduced GDP growth forecast of our US Economics team, a higher assumed tariff rate, and higher level of uncertainty that is typically associated with a greater equity risk premium.
3. Conditions for a trough in the market. We believe at least one of the following three developments needs to occur for the stock market to recover. First, an improvement in the outlook for US economic activity, either due to better growth data or a change in tariff policy. Second, equity valuations or cyclicals vs. defensives equity market pricing of economic growth that is well below our baseline forecast. Third, depressed investor positioning.
4. Recession scenario. The recent sharp increase in the Economic Policy Uncertainty Index has prompted many portfolio managers to inquire about the implications of a potential recession on the US equity market. Historically, the median peak-to-trough decline in S&P 500 earnings during 12 economic downturns since WWII equals 13%. During recessions, the index level typically declines by 24% from its peak. Outside of a recession, history shows that S&P 500 drawdowns are usually good buying opportunities if the economy and earnings continue to grow, which is our base case scenario.
5. We recommended two investment strategies for our base case outlook and one suggestion for clients concerned about the possibility of a recession:
(a) Portfolio managers should own "Insensitive" stocks that are insulated from the major thematic drivers of ongoing market volatility. Exhibit 19 contains a list of 45 companies with the lowest recent share price sensitivity – positive or negative – to the equity market's pricing of US economic growth, trade policy risk, and AI.
(b) Investors should consider stocks hammered by the hedge fund positioning unwind that trade at discounted valuations. Exhibit 20 lists 24 stocks in our Hedge Fund VIP basket and AI Phase 3 basket that have declined by more than 15% from their respective 52-week highs and trade at or below their 3-year median P/E multiple.
(c) Investors concerned about the risk of recession should own our Stable Growth basket (GSTHSTGR). The 50 stocks in our sector-neutral basket have delivered the most stable EBITDA growth in the S&P 500 during the past decade (Exhibit 21).
Exhibit 1: The Magnificent 7 have lagged during the recent drawdown
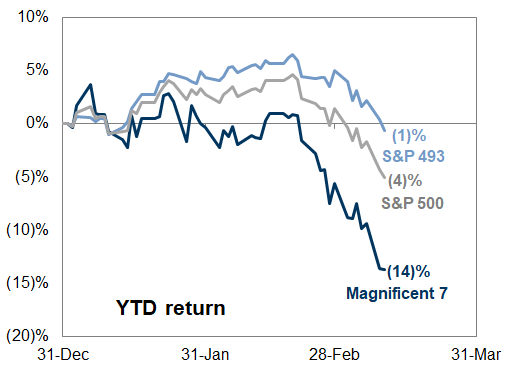
Source: Goldman Sachs Global Investment Research
Exhibit 2: Performance of the Magnificent 7 vs. 52-week high
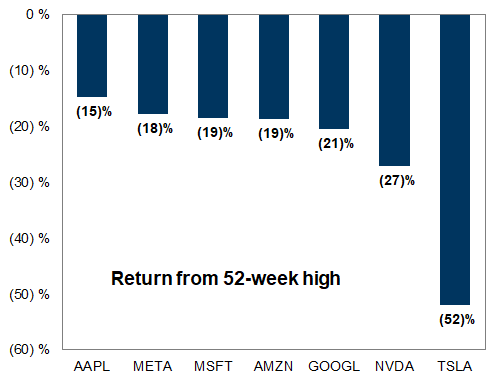
Source: FactSet, Goldman Sachs Global Investment Research
Lowering our S&P 500 EPS and valuation forecasts; similar return from a lower level
Our new S&P 500 year-end target of 6200 (from 6500) implies an 11% return from today, similar to the return forecast we expected at the beginning of this year but from a lower starting point. The 5% reduction in our target embeds a 20.6x forward P/E multiple and an expectation consistent with history that by year-end consensus 2026 EPS estimates will be trimmed by 3% to $300.
We reduce our top-down forecasts for S&P 500 earnings to $262 per share in 2025 (from $268) and $280 in 2026 (from $288), reflecting 7% growth in each year. We previously expected 9% EPS growth in 2025. Our 2026 EPS growth estimate is unchanged. Both our 2025 and 2026 EPS forecasts are below the top-down and bottom-up consensus. However, the bottom-up consensus estimate typically is too optimistic and is gradually revised lower over the course of the year by an average of 4%.
Exhibit 3: We now forecast 7% S&P 500 EPS growth in 2025, below top-down and bottom-up consensus estimates
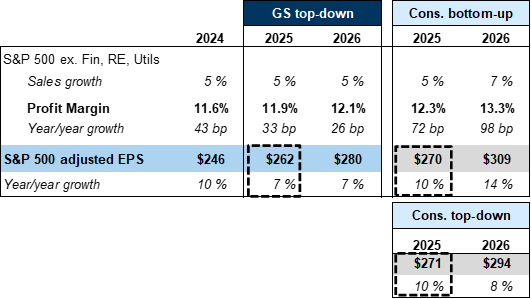
Source: Bloomberg, FactSet, Goldman Sachs Global Investment Research
Our forecasts embed our economists' revised expectation that the US effective tariff rate will rise by roughly 10 pp to 13%. For tariffs, our rule of thumb is that every 5 pp increase in the US tariff rate reduces S&P 500 EPS by roughly 1-2%, assuming companies are able to pass through most of the tariffs to consumers. In a risk scenario, our economists estimate that the effective tariff rate would rise by 15 pp to 18%. In this scenario, the peak GDP growth hit would be 50 bp larger than in their base case forecast and imply an additional 2% downside to our S&P 500 EPS forecast.
Exhibit 4: GS Economics expects the US tariff rate to rise by 10 pp
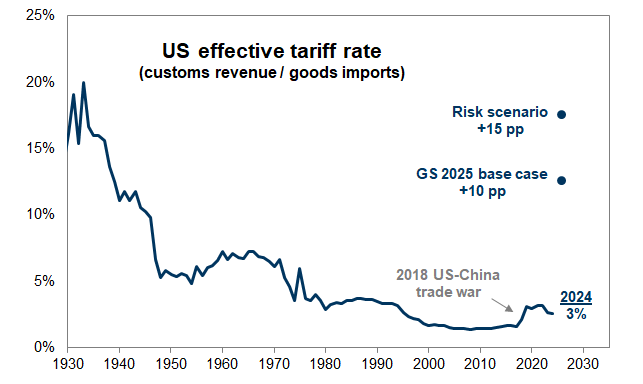
Source: BEA, Goldman Sachs Global Investment Research
Weaker economic activity usually means weaker corporate earnings growth. Our forecasts take into account our economists' revised forecast for 1.7% Q4/Q4 real US GDP growth in 2025, down from 2.2% previously. Their downgrade results from a combination of the tax-like effect of rising tariffs, elevated uncertainty, and tightening financial conditions.
Elevated current political and economic uncertainty also results in elevated uncertainty around the trajectory of corporate earnings. Earnings will be lower than we currently forecast if tariffs are higher than our economists' current expectations, if companies are unable to share the tariff burden with suppliers and consumers, and if policy uncertainty weighs on consumer and business spending by more than our current GDP estimates imply. In our top-down earnings model, each 100 bp of real US GDP growth is worth 3.5% on S&P 500 EPS, holding all else equal. In terms of world (ex-US) growth, each 100 bp shift in growth translates into a 0.7% impact on S&P 500 EPS, all else equal.
Exhibit 5: Sensitivity of our top-down S&P 500 EPS model to macro inputs
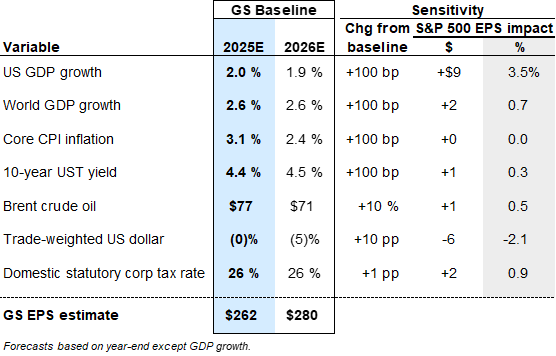
Source: Goldman Sachs Global Investment Research
Higher uncertainty and slower earnings growth also mean lower fair-value multiples. In the past, sharp increases in economic policy uncertainty have typically been associated with a widening equity risk premium, and this pattern has been repeated recently. The US Economic Policy Uncertainty Index has more than doubled since Inauguration Day, and during the same period the gap between the S&P 500 EPS yield and the real 10-year US Treasury yield has widened by about 100 bp, from 200 bp to 300 bp.
Exhibit 6: Economic policy uncertainty has surged
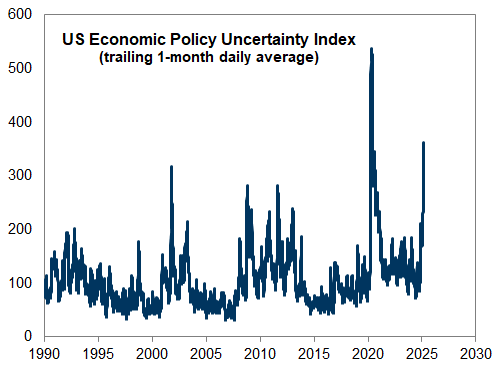
Source: Policyuncertainty.com, Goldman Sachs Global Investment Research
Exhibit 7: Equity risk premium usually expands when policy uncertainty jumps
3-month changes since 1990
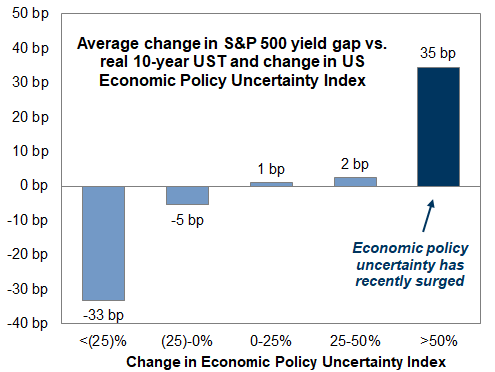
Source: Goldman Sachs Global Investment Research
Exhibit 8: The S&P 500 yield gap, a proxy for the equity risk premium, has increased YTD
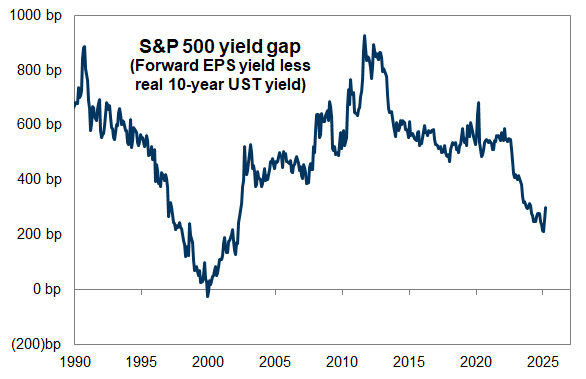
Source: FactSet, Goldman Sachs Global Investment Research
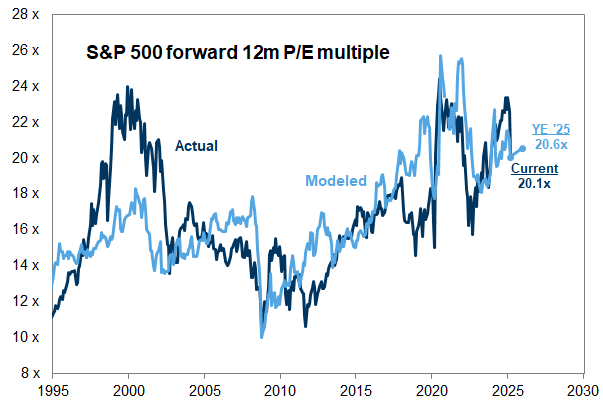
The headwinds to equity valuations from a spike in uncertainty are typically relatively short lived. However, an outlook for slower growth suggests lower valuations on a more sustained basis. Uncertainty should eventually retreat and positioning should stabilize in the near future, likely partially reversing some of the recent expansion in the equity risk premium. However, our revised economic and earnings growth forecasts suggest the S&P 500 will continue to trade at a lower multiple than we previously expected. Our S&P 500 valuation model incorporates a variety of metrics reflecting the macroeconomic backdrop and corporate fundamentals, including the health of the labor market and consensus expectations for S&P 500 EPS growth.
Today, our model points to a fair-value P/E multiple of 20x, in line with the actual multiple. Our model points to a slightly higher multiple of 20.6x at year-end 2025, compared with our prior expectation of 21.5x.
Exhibit 9: We model a slight rebound in the S&P 500 P/E ratio during the next several months
Source: Goldman Sachs Global Investment Research
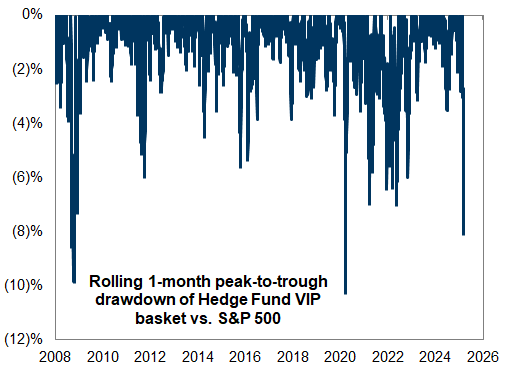
From the perspective of supply and demand, the decline in equity valuations also reflects a major unwind in positioning, especially among hedge funds. During the past month, our Hedge Fund VIP list of the most popular hedge fund long positions has suffered its sharpest period of underperformance relative to the S&P 500 since March 2020. This volatility coincides with the sharp positioning unwinds highlighted by GS Prime Services as well as the moves in Momentum and other factors reflecting crowding.
Exhibit 10: Hedge fund selling has weighed on the most popular long positions
Source: Goldman Sachs Global Investment Research
Exhibit 11: Equity rotations reflect sharp recent swings in positioning
*Hedge Fund VIP and Concentrated Short basket returns evaluated relative to S&P 500; trough-to-peak returns evaluated for Concentrated Short basket and Short Interest factor
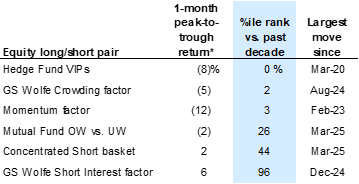
Source: Goldman Sachs FICC and Equities, Goldman Sachs Global Investment Research
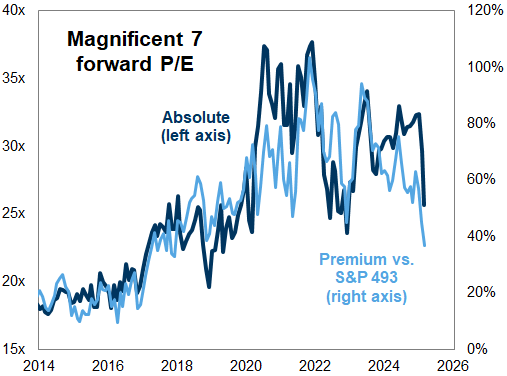
The positioning unwind has also been reflected in the underperformance of the "Magnificent" US mega-cap tech stocks, which now trade at their lowest valuation premium relative to the rest of the S&P 500 since 2017. These stocks rank as top positions in our Hedge Fund VIP list (ticker: GSTHHVIP) as well as popular positions among passive and retail investors. Following their recent underperformance, the Magnificent 7 now collectively trade at a P/E of 26x, the lowest since early 2023. This de-rating has occurred despite consensus expectations that the group will collectively continue to grow EPS at a faster rate than the S&P 493.
Exhibit 12: The mega-cap tech stocks trade at their lowest valuation premium to the rest of the S&P 500 since 2017
Source: FactSet, Goldman Sachs Global Investment Research
Exhibit 13: Mega-cap outperformance has been driven by earnings strength
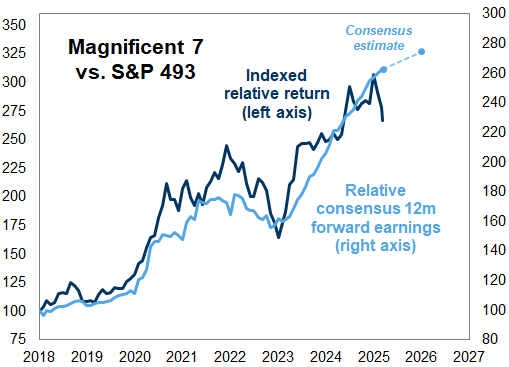
Source: FactSet, Goldman Sachs Global Investment Research
We believe investors will require either a catalyst that improves the economic growth outlook or clear asymmetry to the upside before they try to "catch the falling knife" and reverse the recent market momentum. Valuations, the market's embedded expectations for economic growth, and positioning all suggest the market is currently trading close to fair value. However, our earnings and valuations models reflect the fact that fair value has recently declined sharply.
The rotation from cyclical to defensive industries within the US equity market suggests stocks are currently pricing a growth rate slightly below our economists' base case. As a result, the signal from economic growth data and policy announcements will likely be the key drivers of these rotations going forward. Note that in February the equity market priced a GDP growth rate roughly 150 bp greater than the Bloomberg consensus forecast.
Exhibit 14: Stocks appear to be pricing a GDP growth outlook slightly below GS forecasts
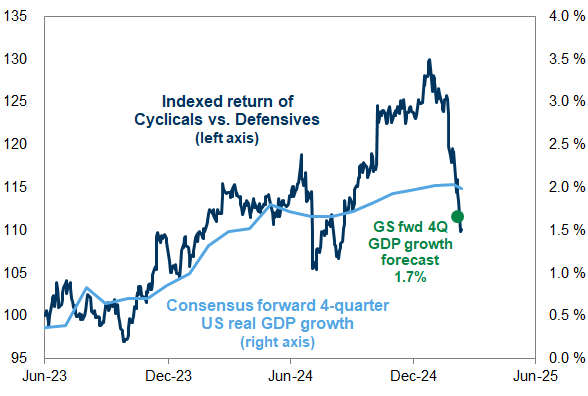
Source: Bloomberg, Goldman Sachs Global Investment Research
Similarly, positioning has declined sharply from a high level, leaving our Sentiment Indicator close to neutral. In the past, deeply negative Sentiment Indicator readings have been statistically-significant signals for above-average prospective equity returns. The latest reading of -0.2 standard deviations (as of Friday, March 7) is still well above levels that have marked the troughs of other major drawdowns. However, price performance and updates from GS Prime Services suggest positioning has declined further so far this week.
Exhibit 15: Investor positions in US equities have declined sharply but are still not depressed
as of March 7, 2025
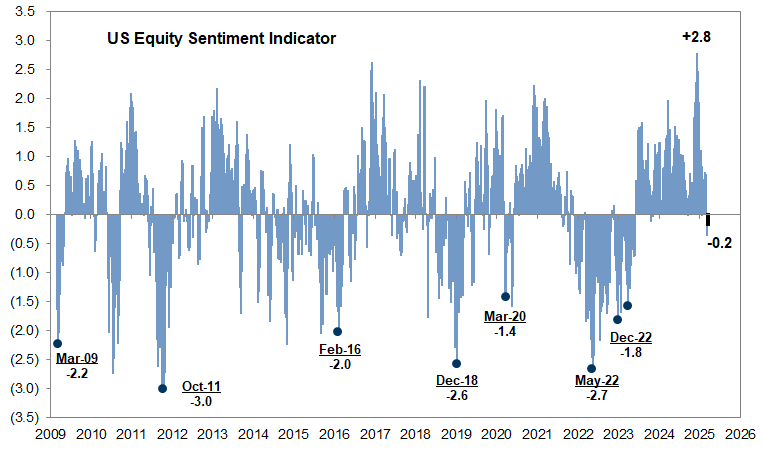
Source: Goldman Sachs Global Investment Research
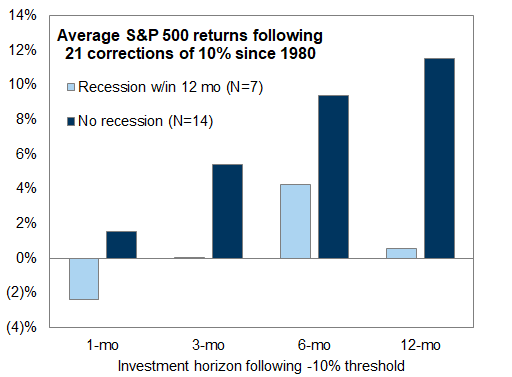
History shows that S&P 500 drawdowns are usually good buying opportunities if the economy and earnings continue to grow. The YTD peak-to-trough S&P 500 decline of 9% remains shy of the 10% median calendar year drawdown since 1980. During this time frame, an investor buying the S&P 500 after it declined by 10% from its high would have enjoyed a positive return during the subsequent 6 months in 76% of 21 episodes, with the hit rate rising to 86% excluding the 7 episodes that occurred within 12 months of a recession (Exhibit 16).
The key market risk going forward is a major further deterioration in the economic outlook. The S&P 500 has declined by a median of 24% from peak to trough around recessions since WWII. Our economists assign a 20% probability of recession during the next 12 months, slightly above the unconditional historical average of 15%. In contrast, consensus assigns a 25% likelihood of recession, reinforcing the importance of upcoming economic growth data for the trajectory the equity market.
Exhibit 16: S&P 500 corrections are usually good buying opportunities
Source: Goldman Sachs Global Investment Research
Exhibit 17: The S&P 500 has experienced a median annual drawdown of 10% during the last 40 years
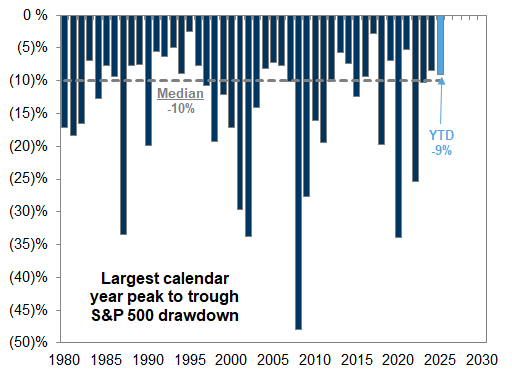
Source: Goldman Sachs Global Investment Research
Within the US equity market, investors should focus on "Insensitive" stocks that are insulated from the major thematic drivers of ongoing market volatility. The combination of elevated uncertainty and relatively balanced current pricing means investors taking a view on how the market will price economic growth, trade policy, and AI enthusiasm will expose their portfolios to a high probability of poor risk-adjusted returns.
We create an Insensitive Portfolio by screening for Russell 1000 stocks with the lowest recent share price sensitivity – positive or negative – to the equity market's pricing of US economic growth, trade risk, and AI. Our proxies for the three themes: for growth (the GSPUCYDE basket pair), for trade risk (GS24TRFS), and for AI (GSTMTAIP). Since November, these three factors have combined to explain just 17% of the return of the median stock in Exhibit 19, compared with 36% for the median Russell 1000 stock. We further refine the list to stocks with above-average earnings growth stability during the past decade. We exclude stocks with weak consensus EPS growth in 2025 or 2026, large downward revisions to consensus EPS estimates during the last few months, or very elevated option-implied volatility.
Exhibit 18: The Insensitive Portfolio has demonstrated little correlation with economic growth expectations
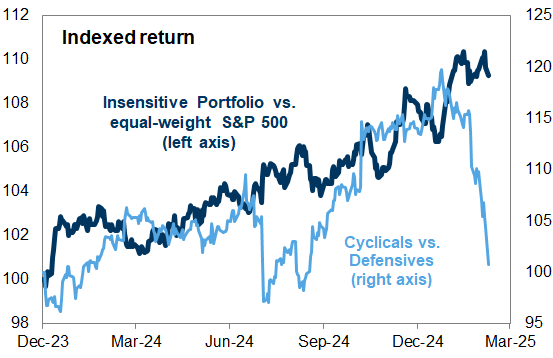
Source: Goldman Sachs Global Investment Research
The positioning unwind should also create an opportunity to buy stocks that trade at discounted valuations. Exhibit 20 below shows the stocks in our Hedge Fund VIP basket and AI Phase 3 basket that have declined by more than 15% from their respective 52-week highs and trade at or below their 3-year median P/E multiple.
For investors concerned about further downside to the economic growth outlook, we also rebalance our sector-neutral Stable Growth and Quality baskets. The Stable Growth basket (GSTHSTGR) of stocks with the most stable EBITDA growth during the past decade has returned 1% YTD. The Quality basket (GSTHQUAL), which consists of S&P 500 stocks with strong balance sheets, high ROE, stable historical sales growth, and low historical downside earnings and share price variability, has returned -1%. "Quality" stocks typically perform well amid rising uncertainty and declining economic growth expectations. However, most "quality" attributes – including low volatility – now trade at extremely elevated valuations relative to history, as evidenced by the P/E multiples of stocks in our Stable Growth (Exhibit 21) and Quality (Exhibit 22) baskets.
Exhibit 19: Insensitive Portfolio
Russell 1000 stocks with low price sensitivity to recent thematic equity market rotations, stable historical earnings growth, and healthy consensus earnings outlooks
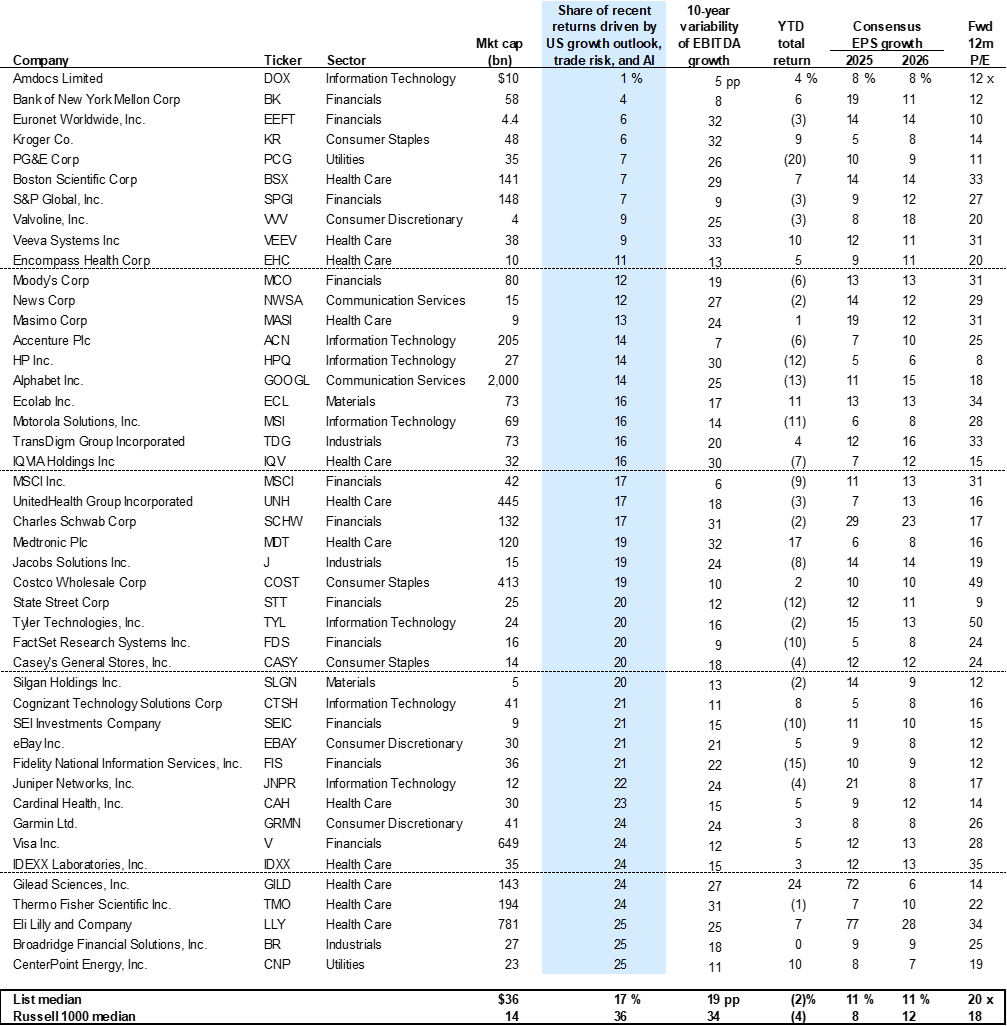
Source: FactSet, Goldman Sachs Global Investment Research
Exhibit 20: Stocks in GSTHHVIP and GSCBAIP3 that are 15% off their 52-week highs
as of March 10, 2025; based on intra-day high, excludes companies with negative 2025 EPS growth and negative 2025 EPS revisions YTD
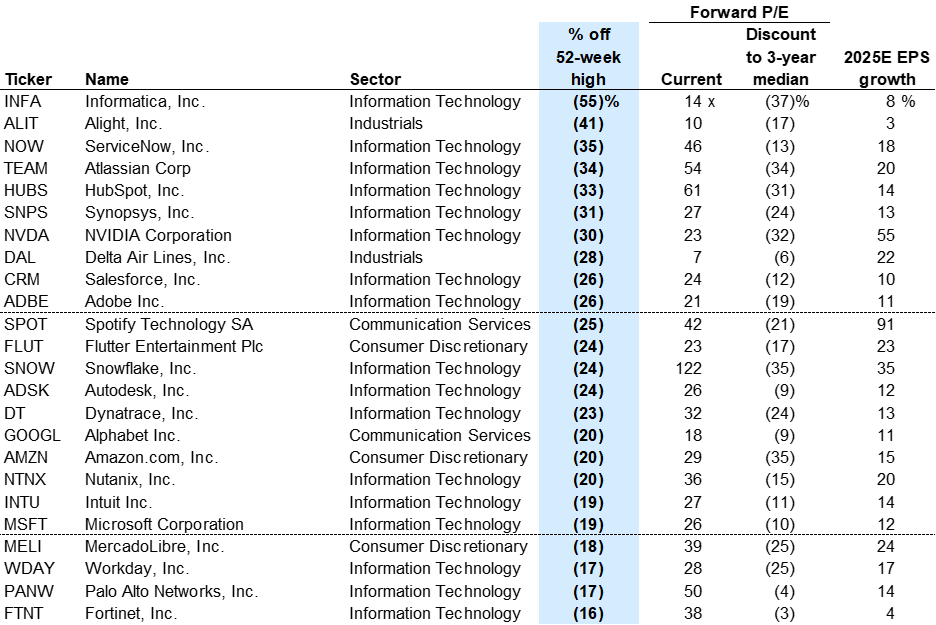
Source: FactSet, Goldman Sachs Global Investment Research
Exhibit 21: Constituents of our Stable Growth basket (GSTHSTGR)
as of March 10, 2025
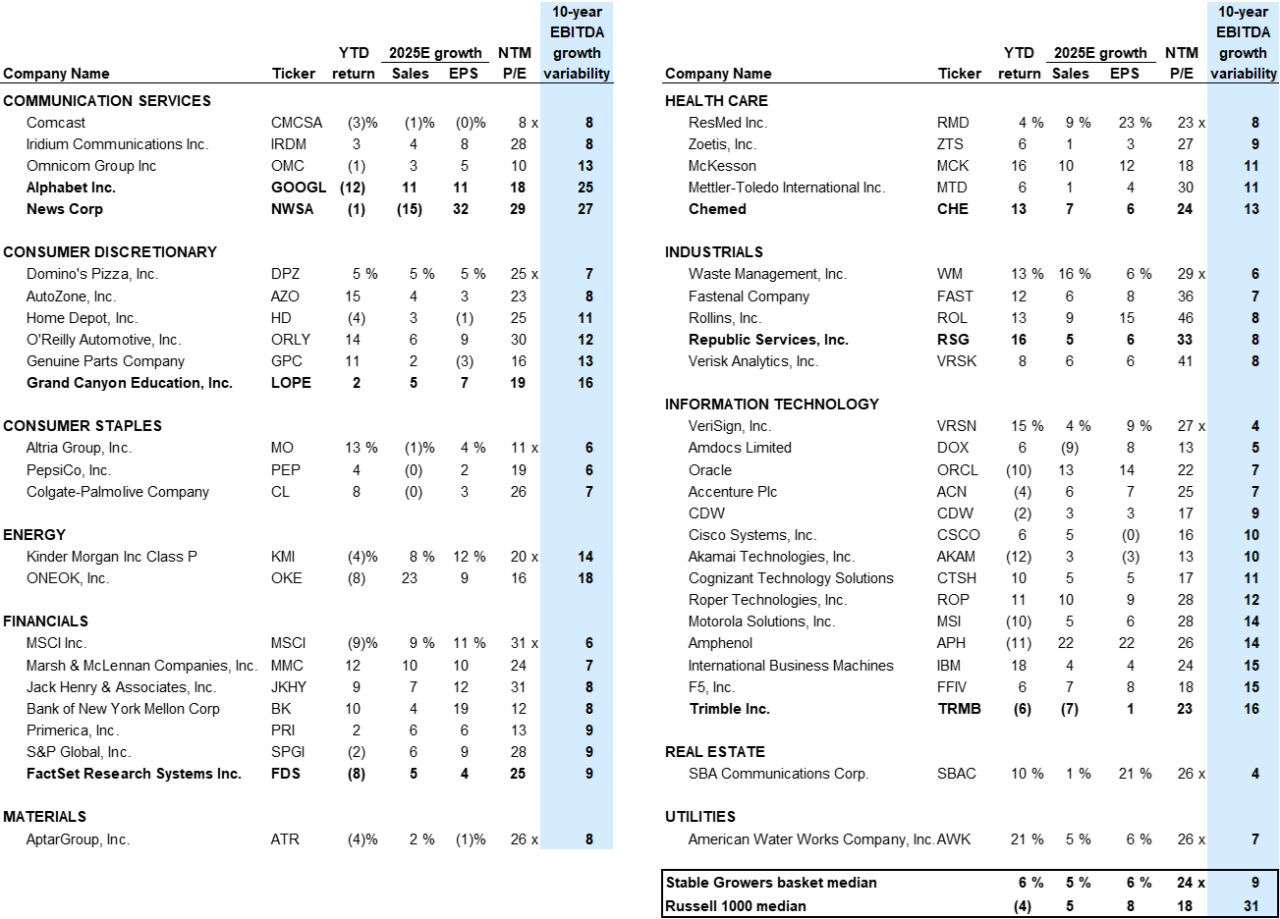
Source: FactSet, Goldman Sachs Global Investment Research
Exhibit 22: Constituents of our High Quality basket (GSTHQUAL)
as of March 10, 2025
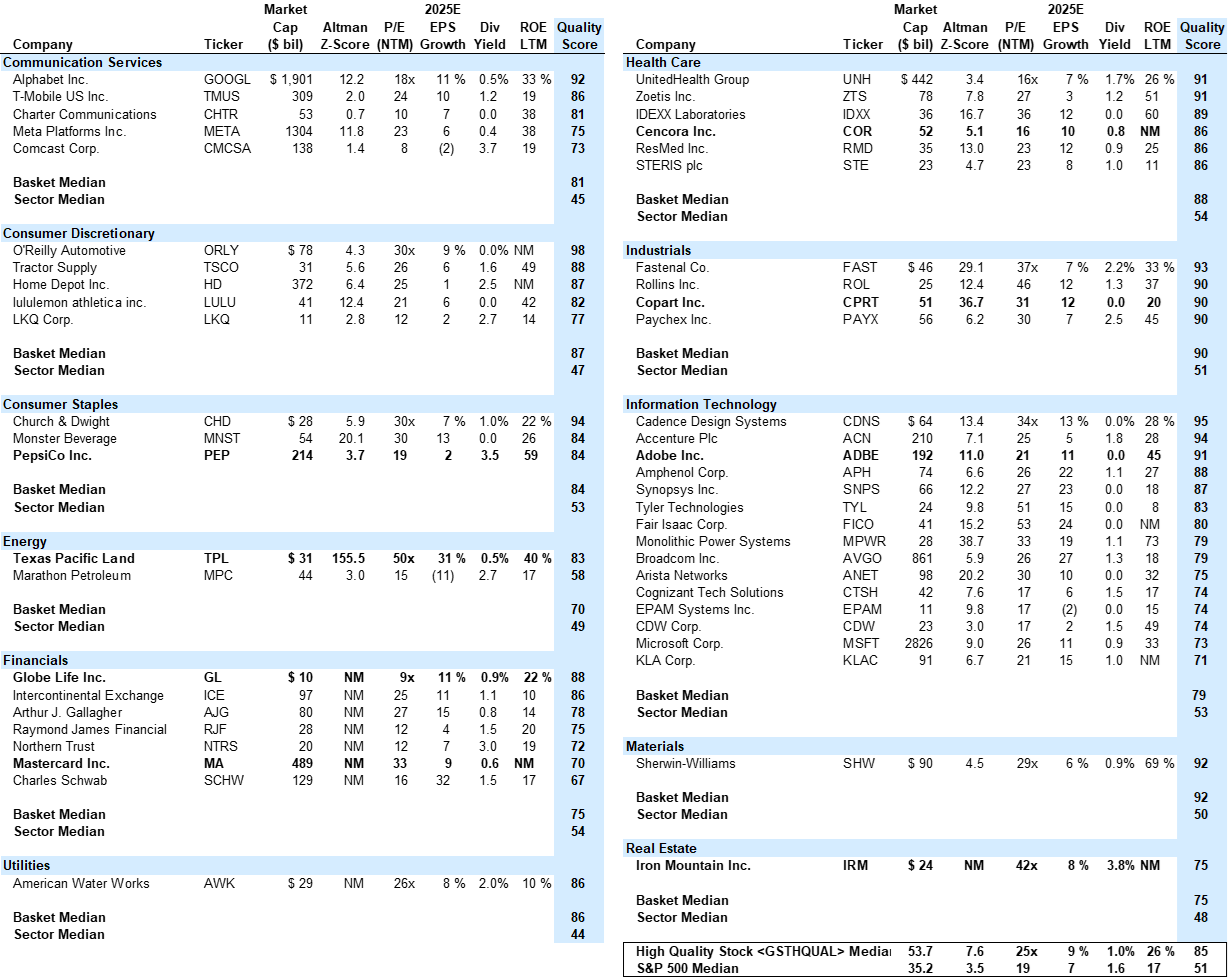
Source: FactSet, Goldman Sachs Global Investment Research
Investors should consider this report as only a single factor in making their investment decision. For Reg AC certification and other important disclosures, see the Disclosure Appendix, or go to www.gs.com/research/hedge.html.